Getting Started with .NET Explorer 2025
Note: this guide was written with the AngleSharp assembly, but the new default trial assemply is FluentAssertions because it is easier to comprehend.
This is a static tutorial on using .NET Explorer 2025. I am in the process of authoring some YouTube videos for more detailed operation of the application.
Getting the application up and running.
- Download the application from this Web site . If you are on Windows I recommend the ZIP file, as it is smaller.
- Please run your favorite anti-virus software on the download. Because this is a new program (just launching) Norton (for example) will complain that there are few users and so there is not enough information to develop a trust level.
- Create a directory where you wish to install. The nice thing about using a ZIP or TAR file is that you never need elevated permissions to install.
- Unpack your ZIP or TAR file, and then open your favorite shell in the install directory. List the files starting with D* and R*.
Below is a screen shot of PowerShell 7 on Windows. If you are running Linux, you will not see the R1 directory: R1 is an assembly
resolver for the classic .NET framework (up to 4.8.*).
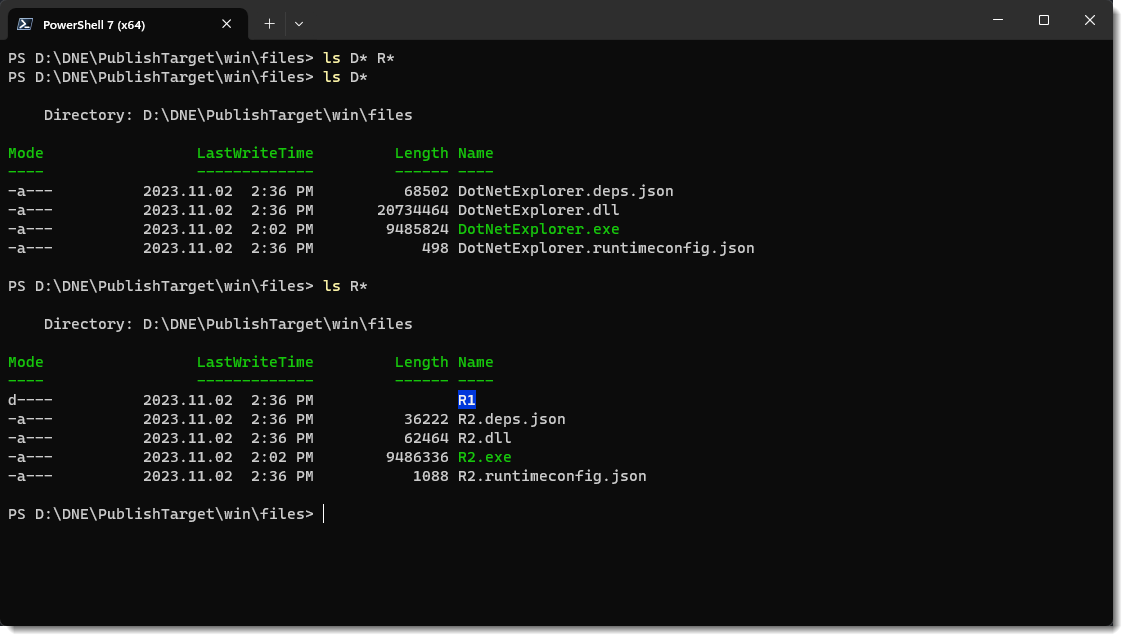
DotNetExplorer.exe is the application; it is an ASP.NET Web server. Once you hit its port with your favorite browser it is going to feel like a desktop application. It has exactly the same code, and look-and-feel on Windows, Linux or Mac.
R1 and R2 are console line assembly resolvers that are used to find assemblies given their logical AssemblyName. They are out-of-process because they load the referenced assembly (which cannot be unloaded later). As the application runs you might see their processes wink into and out of existence.
-
Run the application by simply typing DotNetExplorer.
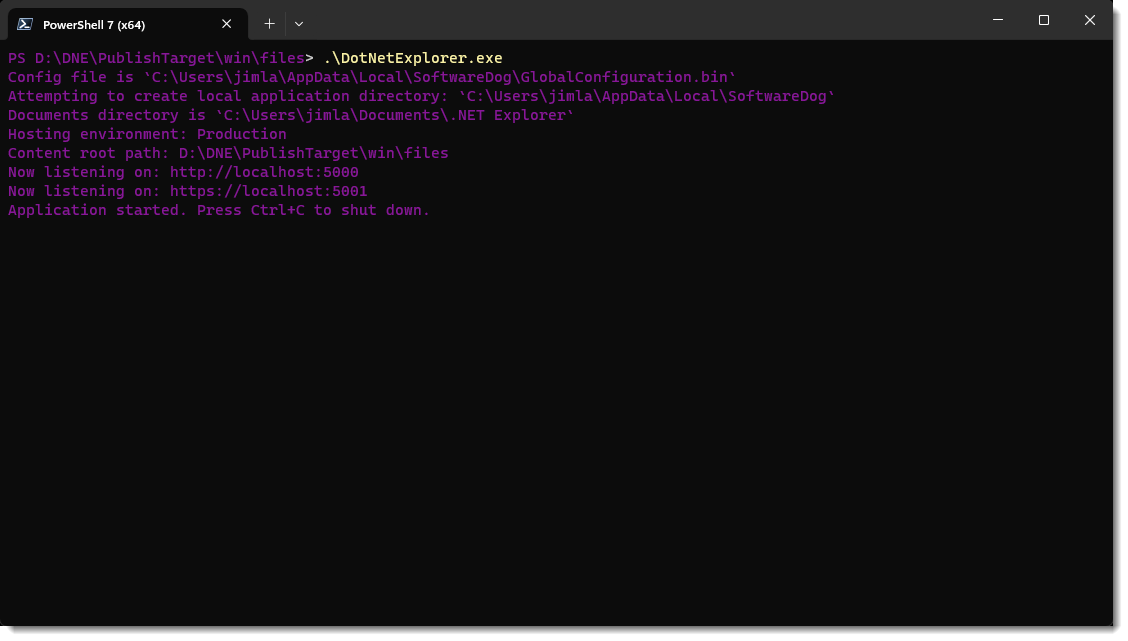
By default ports 5000 and 5001 are used.
-
Open your favorite browser and navigate to http://localhost:5000. After a brief delay as .NET JIT's the
application, you should see the following:

If you are just kicking the tires, then click on the Trial button; the entire program is available, but only for the AngleSharp.dll. This is a very robust .NET assembly and shows what .NET Explorer can do on a complex assembly.
If you have a license key, enter it and click the Activate button. The rest of this tutorial explores a licensed version. You can still follow along if you are trialing.
-
Up and running
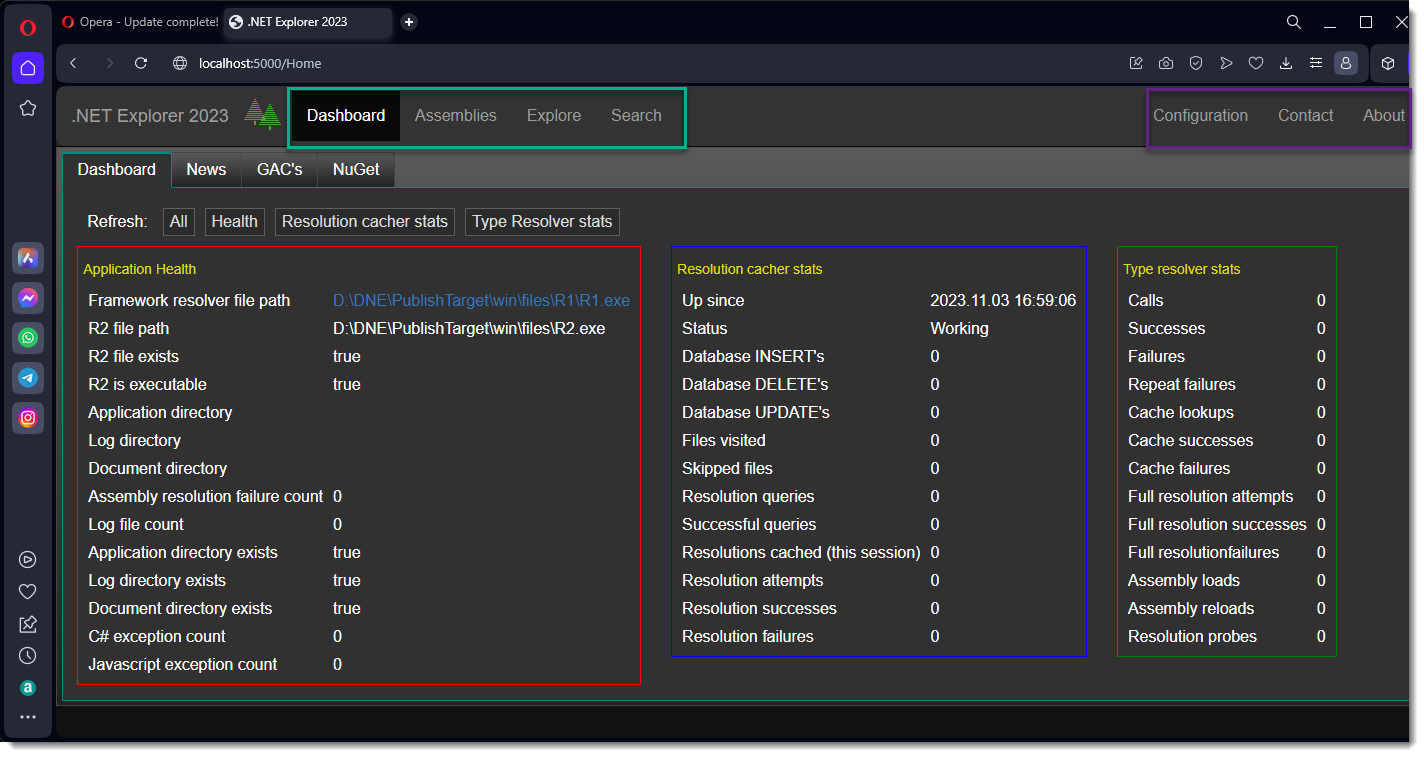
Notice the typical BootStrap navigation bar across the top. The highlighted 4 items on the left are where you are going to spend all your time, especially the Explore page. The more administrative pages are on the right. Before we get into the fun stuff I want to point out some important Admin things (at the Brits would say).
First, click on the Configuration button:
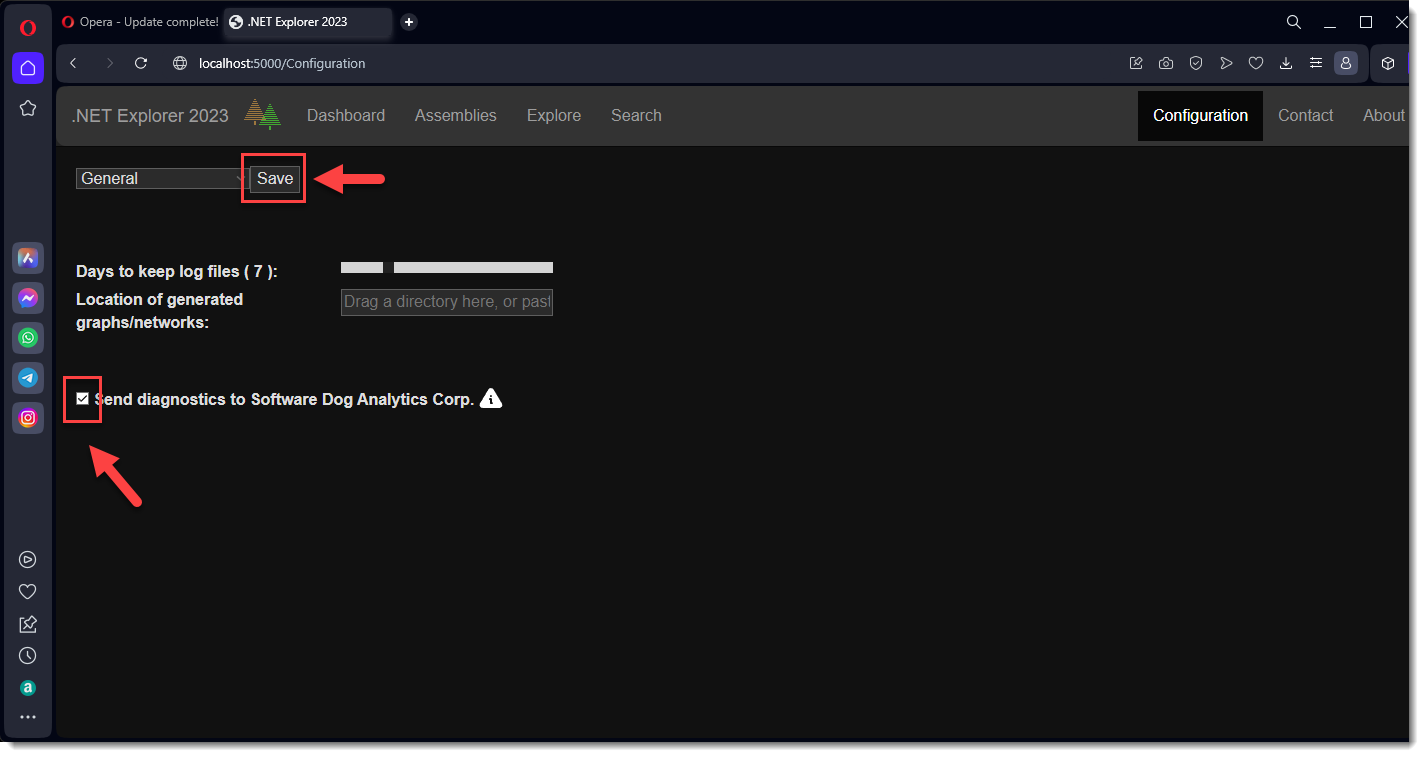 />
/>I would greatly appreciate it if you would "opt in" and allow the application to send me both C# and JavaScript exceptions. No personal data is sent. Don't forget to click the Save button.
Feedback
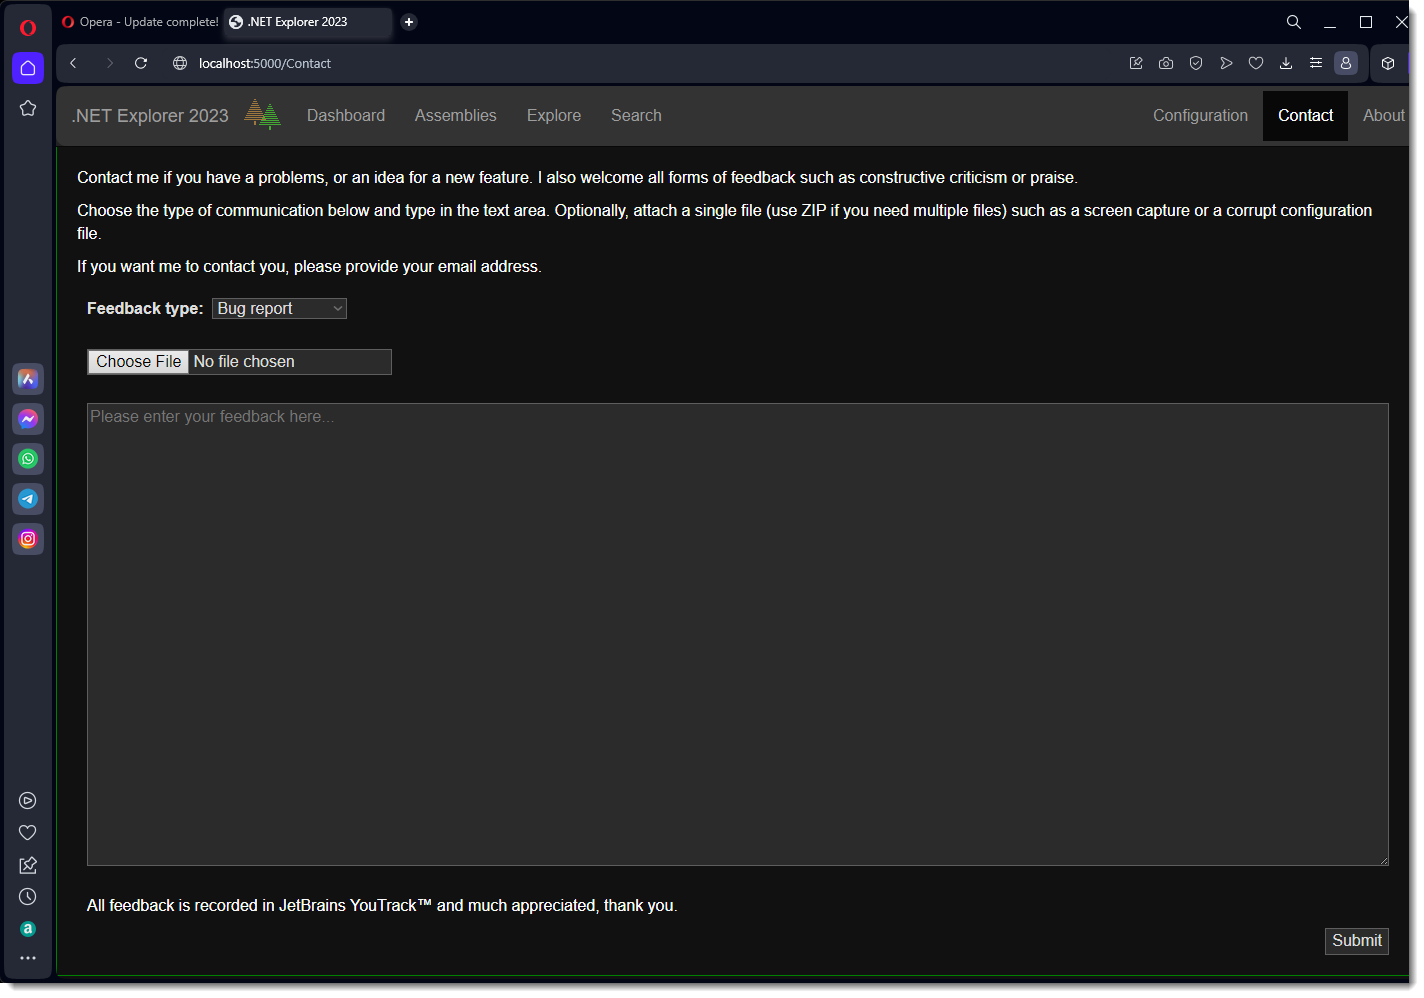
Now click on Contact on the navigation bar. This takes you to page where you give me feedback, report bugs, or request new features. I am using JetBrains YouTrack, and all feedback is logged and acted on. In fact, any feedback is greatly appreciated!
-
Start Exploring!
Now click on Assemblies in the navigation bar. This brings you to a place where you collect all the wonderful 3rd party or internal (to your organization) that you want to shed light on.
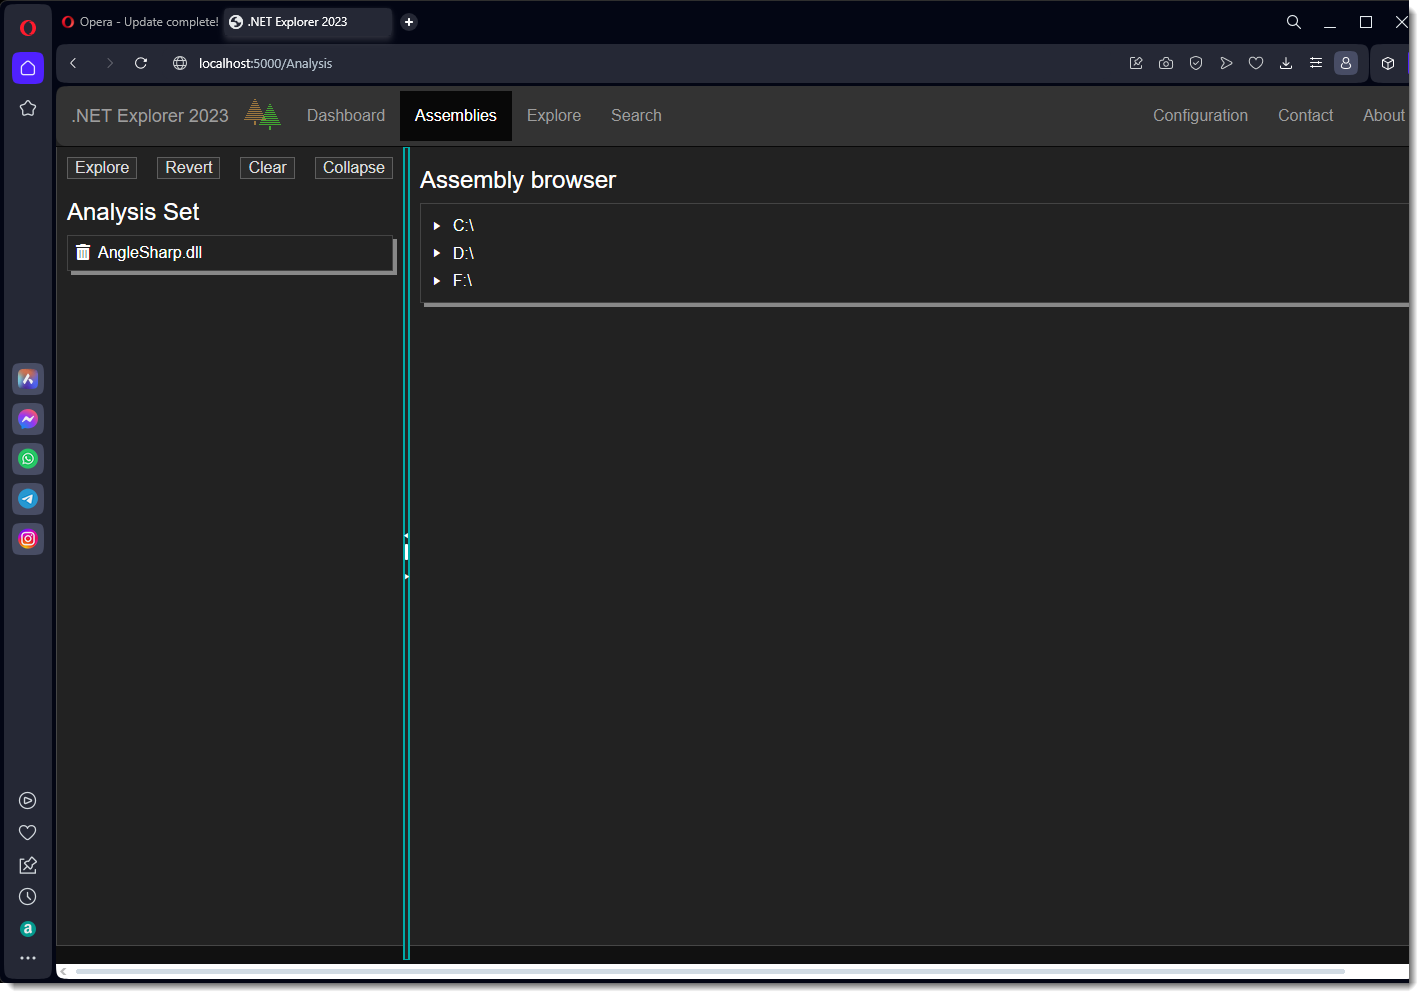
The left side is the Analysis Set, the assemblies you want to explore. A fair amount of work goes on behind the scenes, so we use this set to limit the scope of your compute resources.
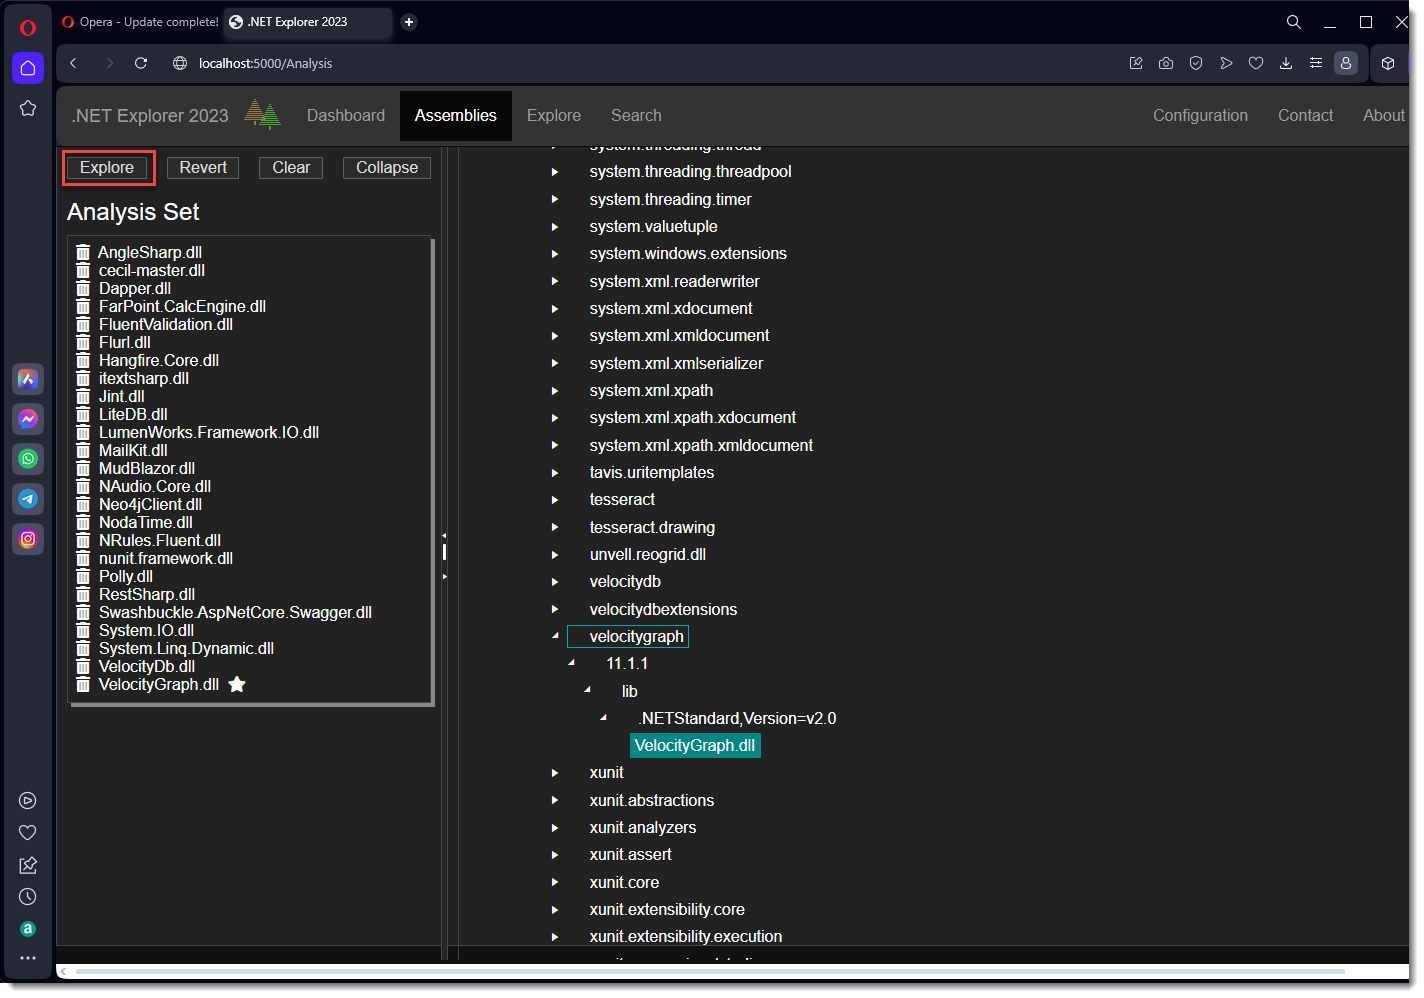
The right side is an assembly browser (not a file browser). It ignores all the files that are not assemblies. Go ahead and find your interesting assemblies; you add one by simply clicking on it. If you add one accidentally, click on the trash icon next to it to delete it. When you are happy, click on the Explore button. Below, I have gone wild and picked many assemblies. Click on the Explore button when you are happy.
-
At long last: EXPLORE!
A lot happens when you hit Explore, but on my machine, it took less than 2 seconds. .NET Explorer loads each assembly using Mono.Cecil (instead of System.Reflection), and creates the Structure Tree you see on the left. You control the actual structure. If you pop open the Structure options ... accordion you see all the ways you might arrange assemblies and types.
The important things in this hierarchy are assemblies and types. The heart of the .NET Explorer application are the visualizations of individual types, or a visualization of an entire assembly, and how its constituent types are coupled.
The right pane of the screen is a big, black void right now, but every time you click on an assembly or a type in the tree, an explorer will popup up with many visualizations. These explorers have many tabs, but the tabs are lazy load, because many of the visualizations are compute-intensive.
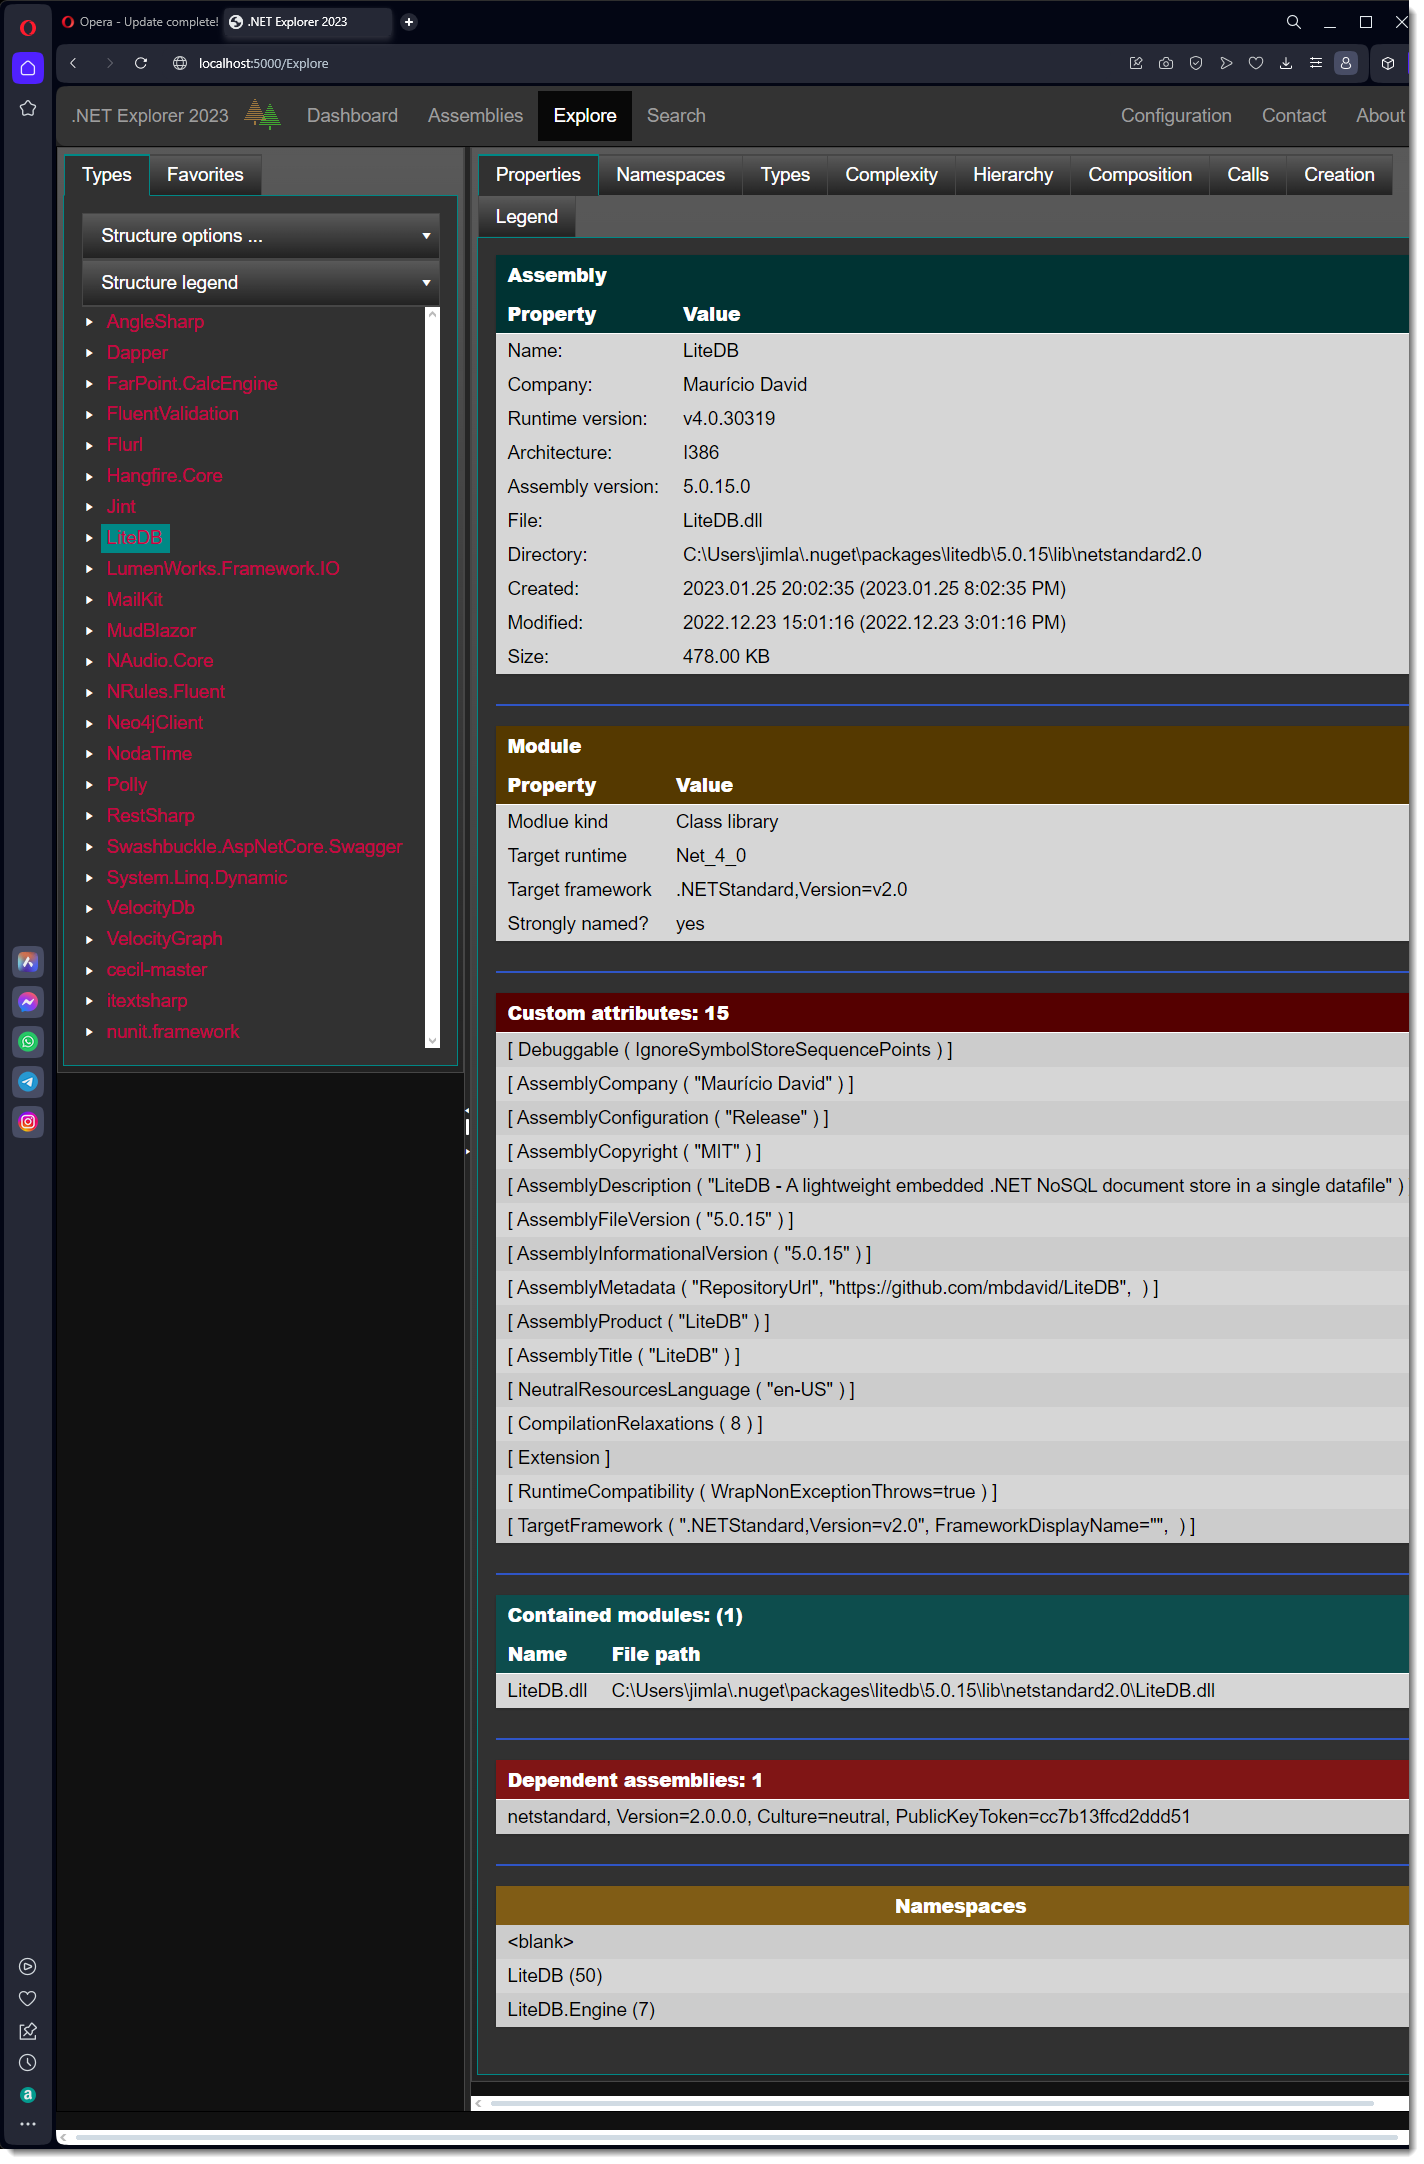
For the rest of this tutorial, I will focus on the LiteDB assembly because it is probably well-known, and not too complicated but still very interesting. As well, it is crafted by our favorite people in the world: open source developers. Here I have clicked on the LiteDb node in the Structure Tree.
-
Assembly views
Recall that all tabs are "load on demand." The first tab, and default, is the assembly properties or metadata. It shows the assembly header, main module header, custom .NET attributes, the dependent assemblies and contained namespaces.
Namespaces
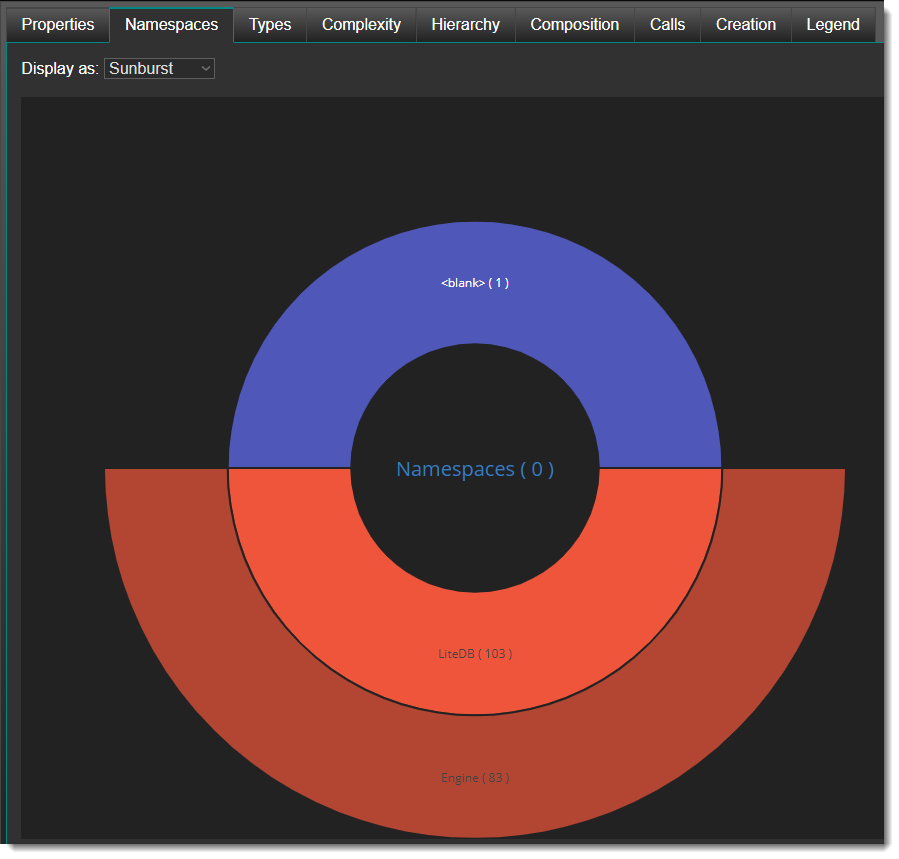
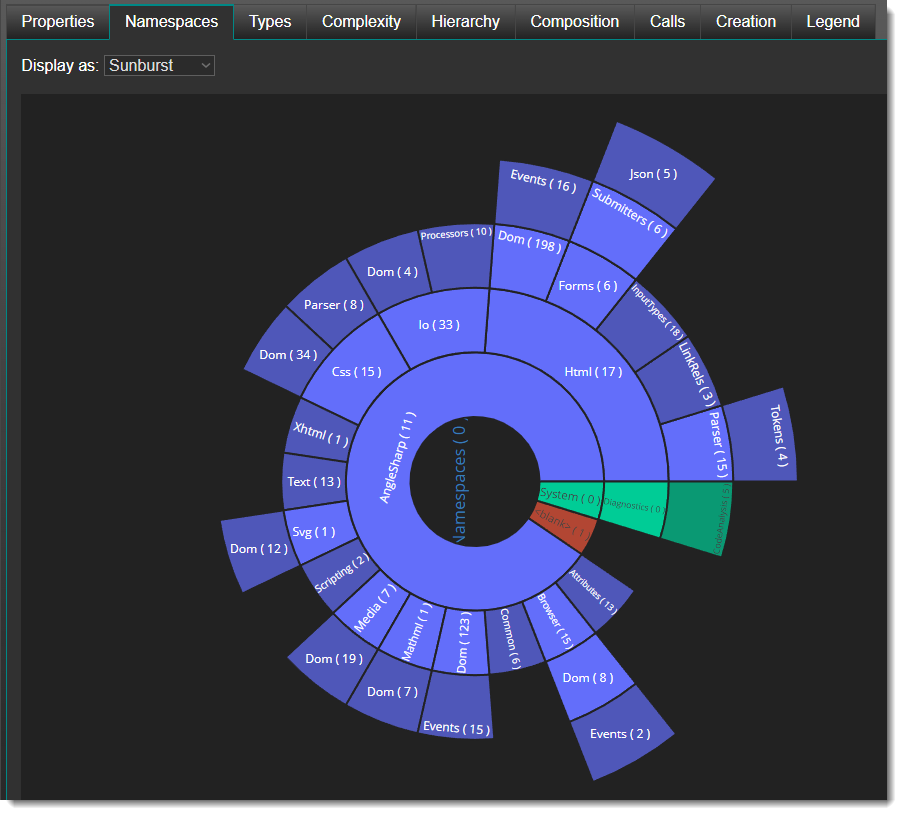
Now click on the Namespaces tab to visualize how types are factored into different namespaces. The LiteDB team decided to keep it simple with 2 namespaces: LiteDB and LiteDB.Engine. Contrast that with AngleSharp on the right.
Types
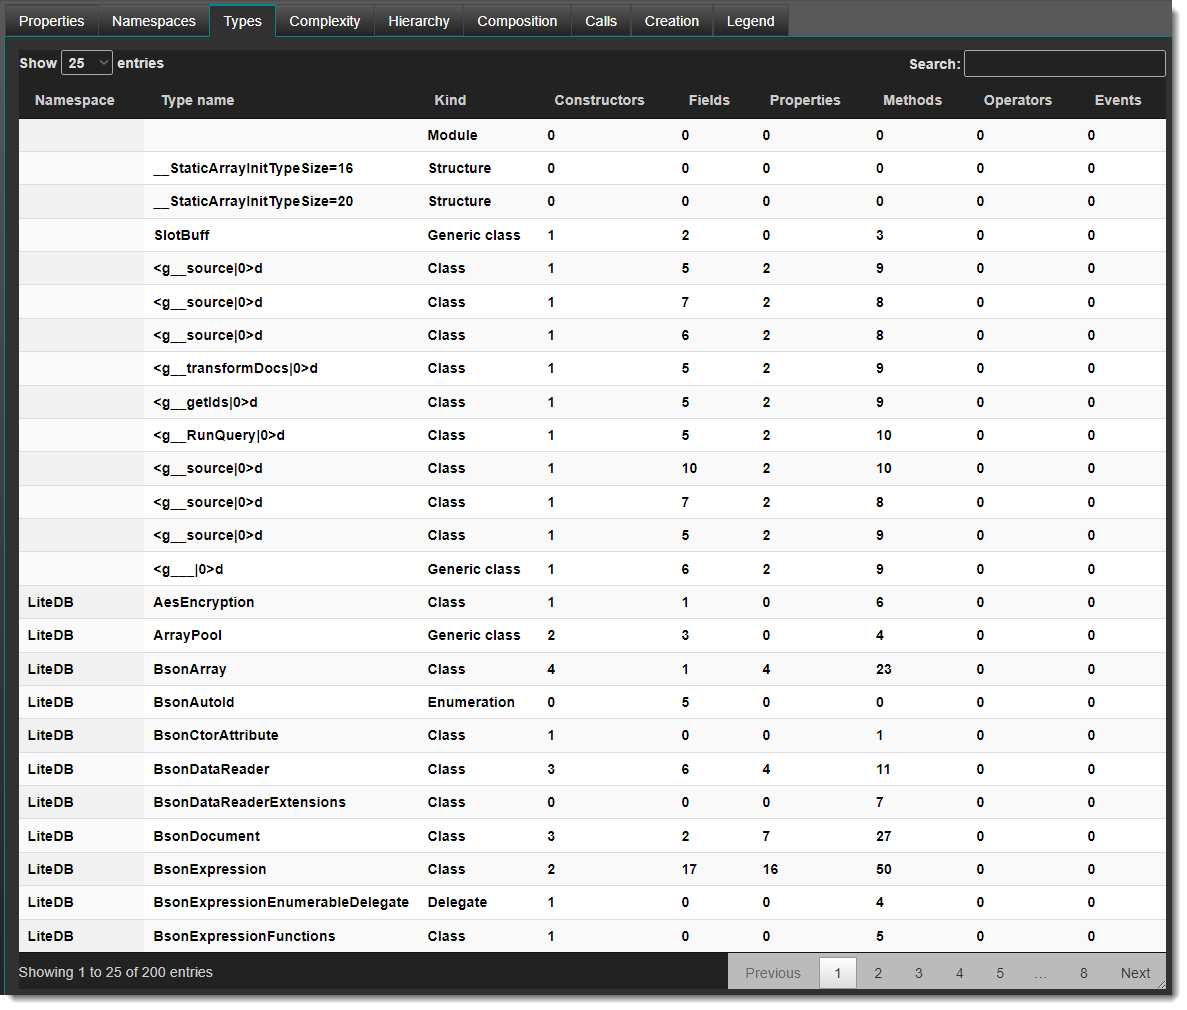
Click on the Types tab to get a textual grid view of all the types in the assembly. I have Show compiler-generated types turned on, so you see some weird type names. This grid view shows up elsewhere, and is sortable, pageable and searchable.
Type complexity
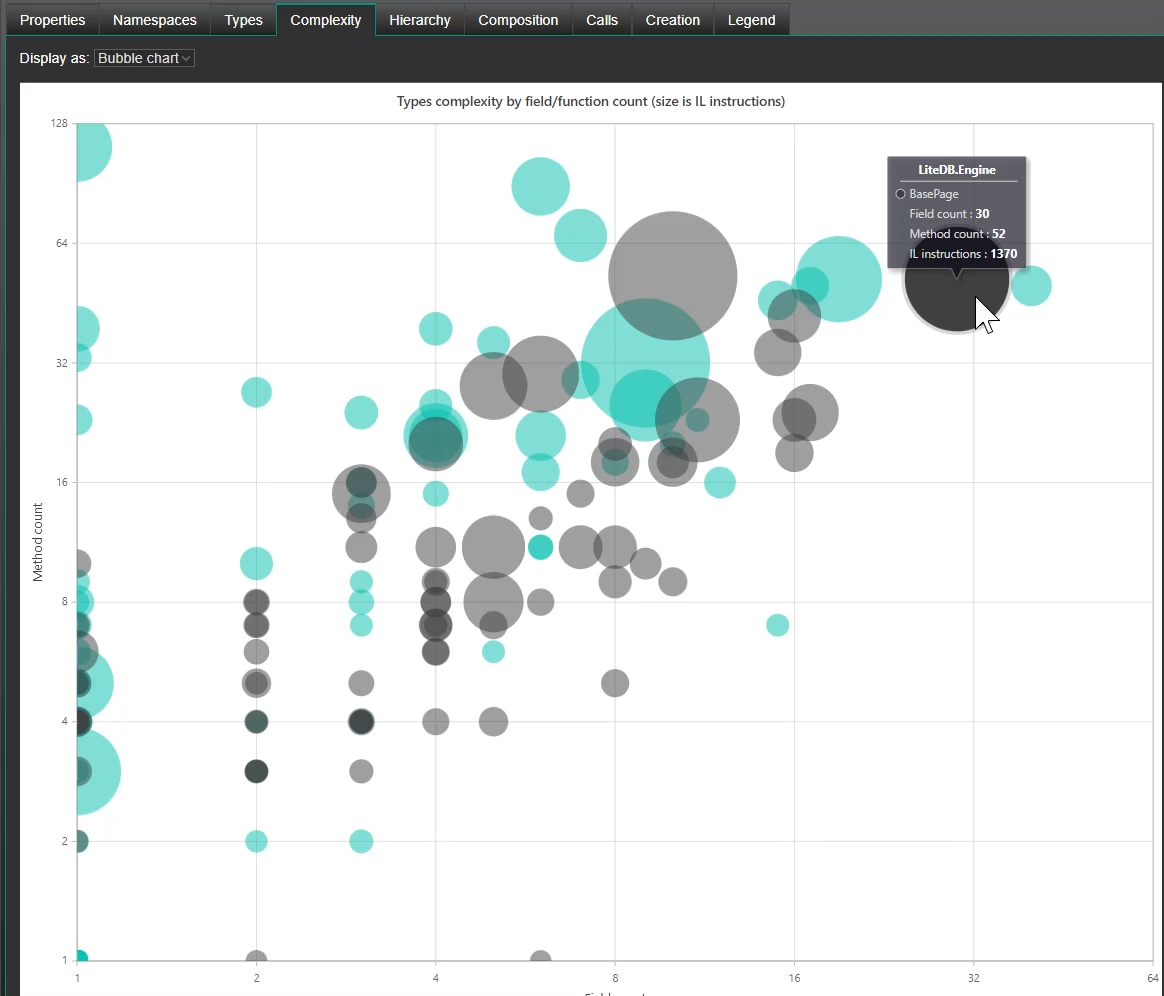
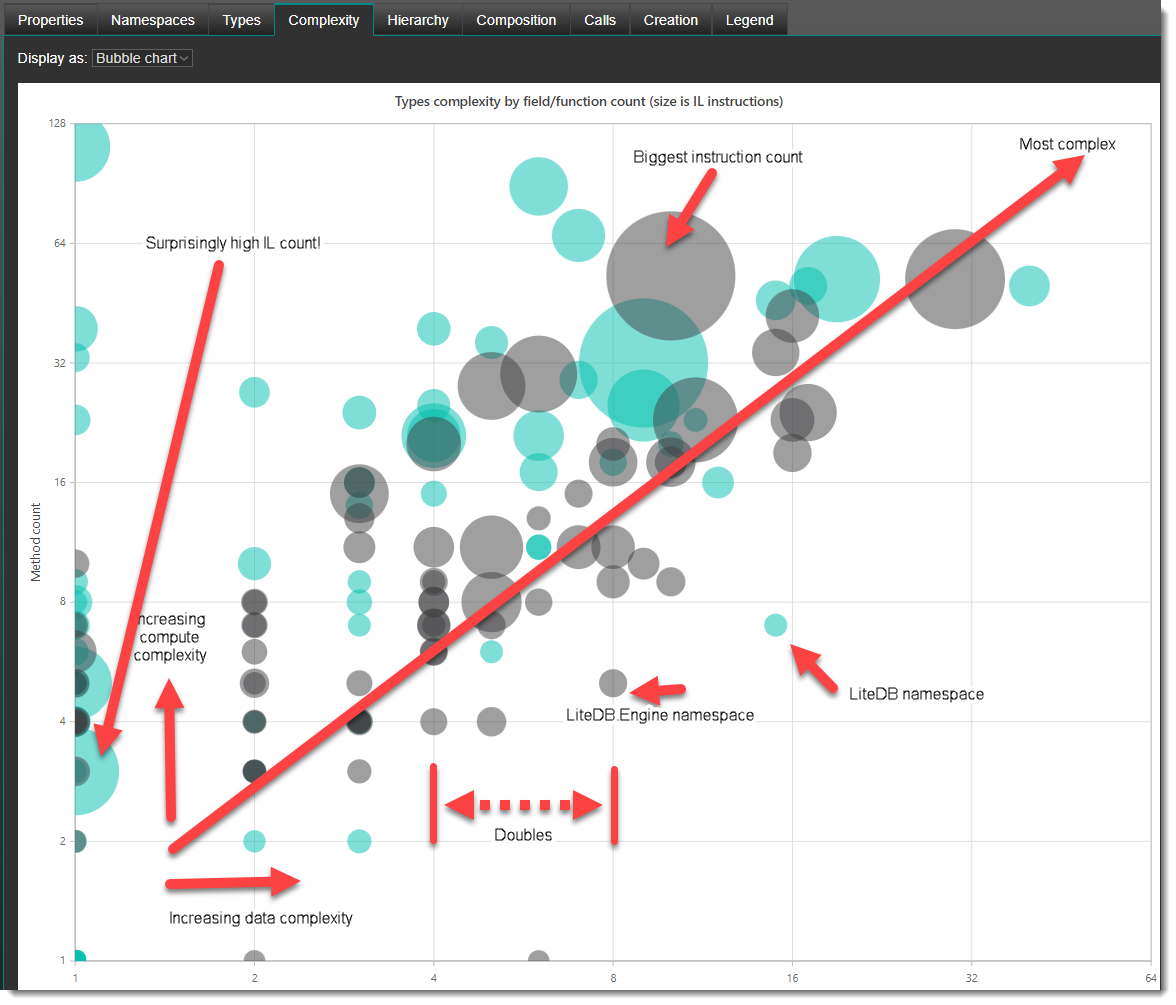
Click on the Complexity tab to navigate to a visualization showing the data and compute complexity of all the types in the assembly.
Things of note:
- The horizontal axis shows type Field count, so types to the right have more fields;
- The vertical axis shows type Method count, so types at the top have more methods;
- Type size of a bubble is proportionate to the number of IL instructions in all method bodies ... usually but not always proportionate to method count;
- Each bar you traverse in either direction doubles the complexity;
- The color is based on the type's namespace; and
- Hover over a bubble for a tooltip telling about the type.
Let's put that all together and illustrate these point directly on the visualization:'
Network (or graph) visualizations
All of the last tabs are the most fun and insightful; they show how types are related to other types in the same assembly. Currently support (by tab name):
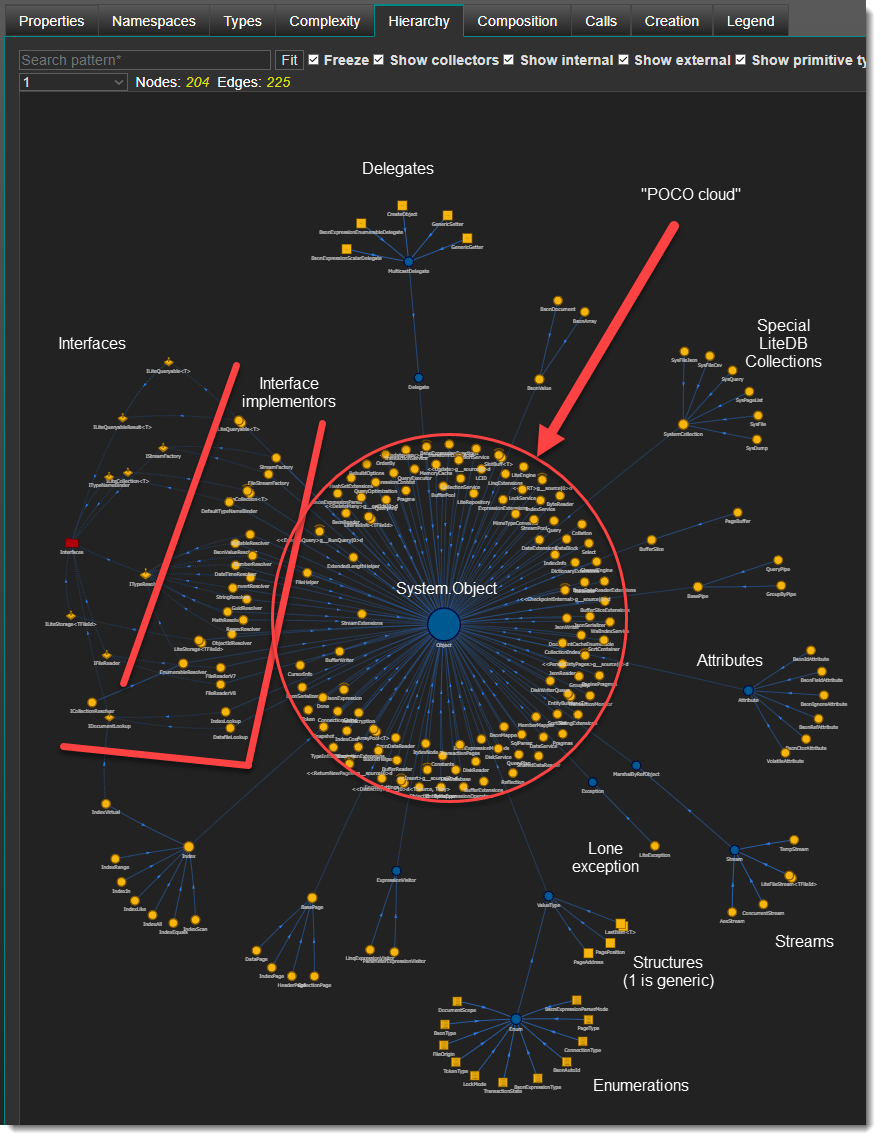
- Hierarchy - shows the base class of a class (System.Object is like a massive black hole), and the interfaces implemented by a class. Also shows when an interface extends another interface;
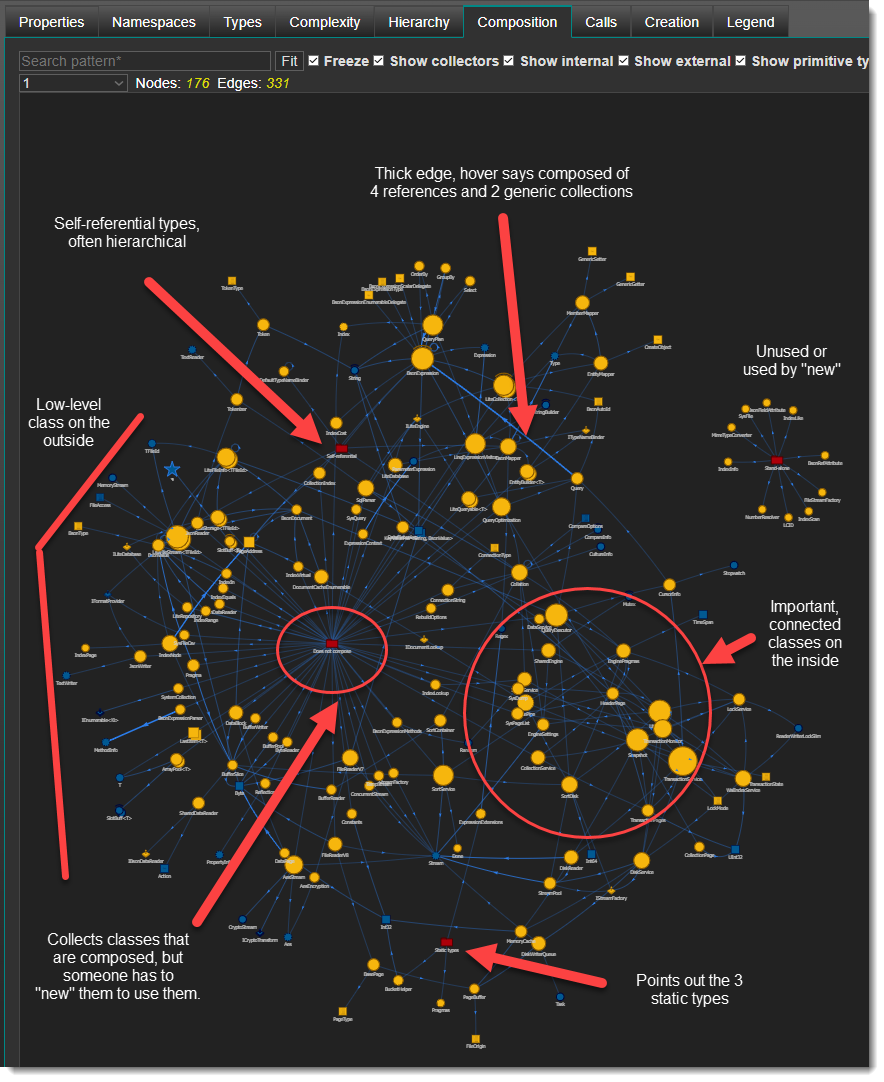
- Composition - shows the static, compile-time fields of a type that are not scalar. For example, if we have Customer, Order and Product classes and we look at the fields of the Order class:
- int OrderNumber
- DateTime OrderDate
- bool IsFullfilled
- Customer Customer
- List<Product> Products
- Calls - shows when a type has one or more calls into a method on another type. Note: this is not a call graph showing a method calls another method. This graph is almost always the largest and hardest to lay out visually. You instantly see software coupling in this graph.
- Creates - this graph shows when a type creates and instance of another type (for example, C# new). If you flip between the Hierarchy and this tab you will often find a software engineer decided not to create a field for a type is uses, but rather just create the new type and use it. As well, a type that creates another type is usually higher up the food chain, also Dependency Injection/Inversion changes that.
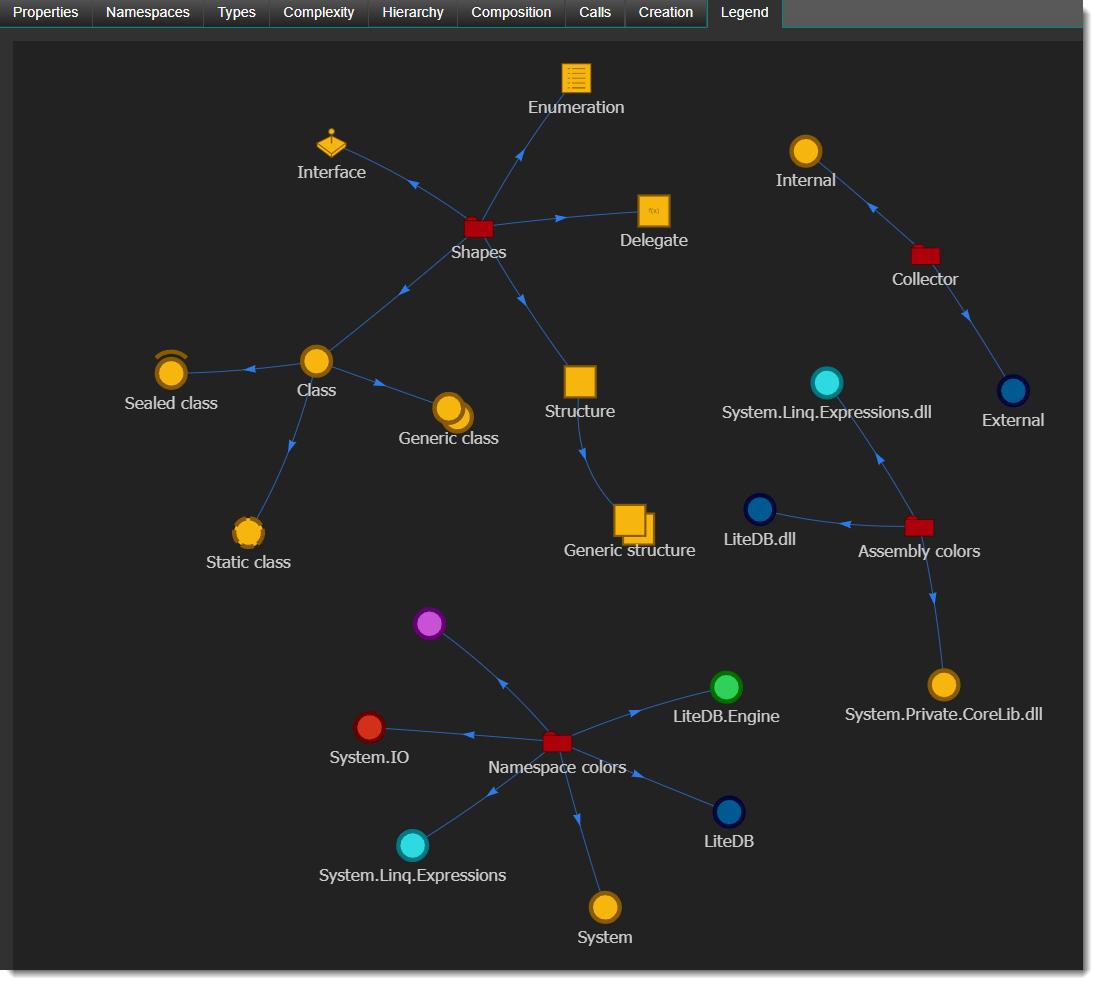
- Legend - this is a legend or key that helps you interpret what the nodes in each visualization means. It illustrates what the various nodes shapes are and how nodes are colored by visibility, namespace or assembly.
Legend
Although the Legend tab is last, it is a useful key to explaining what you see on the 4 calculated networks:
- The shapes are self-explanatory; they show a type's kind;
- Red folders are collectors I generate to group "like" things. They are not types in LiteDB;
- Look at the Collector group: it shows the default coloring. Gold nodes are in LiteDb, and blue nodes are other assemblies; and
- The Assembly colors and Namespace colors show the color of nodes if you change the node coloring (not covered in this tutorial).
Hierarchy
This network shows the logical derivation of classes, and the extension and implementation of interfaces. If you quickly flit through a number of different assemblies in your Analysis Set it is fascinating to see the different design patterns.
Below I have added annotations with red lines, arrows and a circle, and my comments are in large white text. I would like to define the "POCO cloud": this is a ring of Plain-Old-C#-Objects that are orbiting the black hole of System.Object. Most these classes are not derived from. LiteDB's interface cloud is very straight-forward and looks to be well designed. Some assemblies that you might explore can have a tangled rat's nest of interface entanglements.
Composition
As mentioned before, this network shows when a type has fields that are reference types (not scalars).
A few comments if you care to read:
- Recall red folders are just collectors I generate to bring "like" things together; you can turn them off.
- Gold nodes are types in LiteDb, blue nodes are elsewhere, usually in the framework libraries.
- Things on the outside tend to be simple and a lower-level class.
- SIZE MATTERS - the size of a node by default is proportionate to the number of outgoing edges (that is, it is composed of a lot of things). You can flip this to show classes that compose a lot of other classes (incoming edges).
- Edge thickness is a visual clue that there is a one-to-many relationship. Hovering over an edge gives a tooltip showing what all the actual compositions are (examples: 7 instances, array[] and List<T>).
- Note: there might not be an edge between nodes A and B in this network, but you might well see one in the Creation tab because A creates a B and starts using it.
- If you select a node and switch to another network, the corresponding node (should) be highlighted white. Sometimes a node looks important on one network, but is not on another.
Calls
Almost without fail, the most complicated network. Be patient, the application must scan all of the IL and build a graph, then the JavaScript layout engine must do its O(n^2) physics layout. Networks with over 3,000 nodes (and they exist), can bring your power development machine to its knees. Oh, if only the layout were in WebAssembly (actually, I could do the layout, and it would be fun, but it wouldn't be 45 minutes work!). This network has 439 nodes and 1,405 edges.
Please note that this is not a call graph. It simply shows that a type calls something on another type. A true call graph would be horrendous.
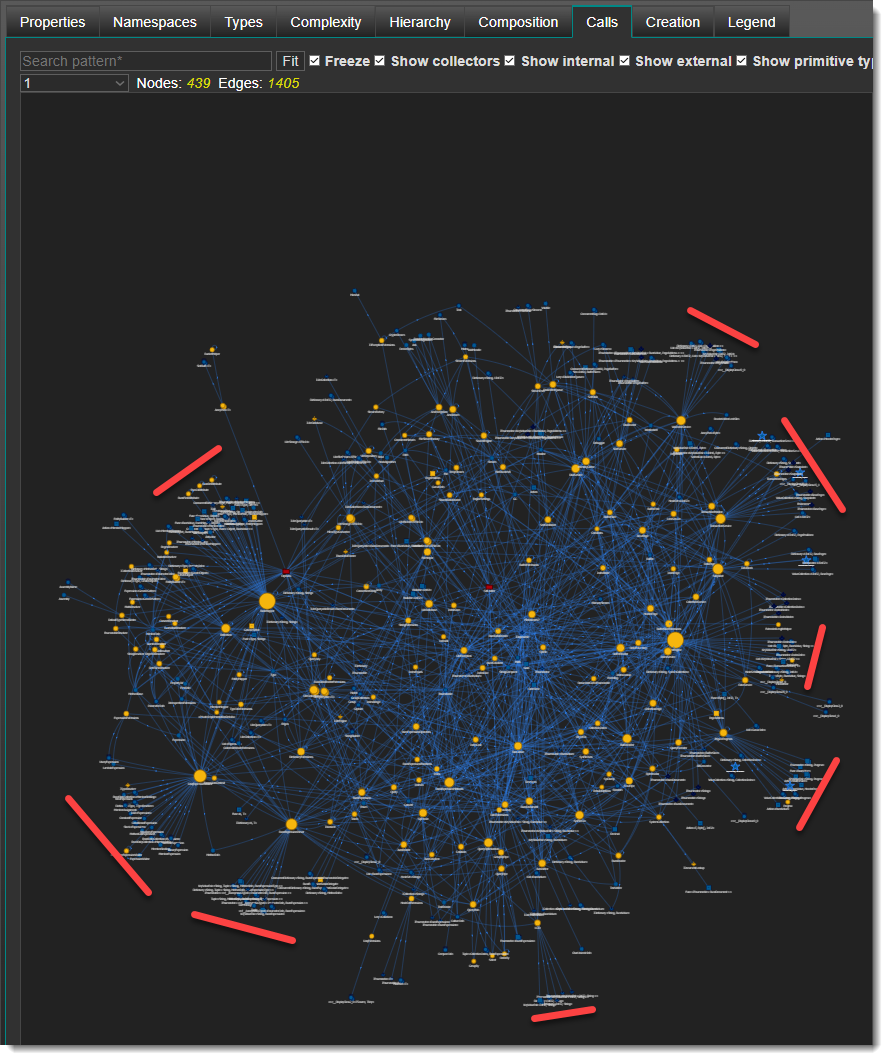
A few notes:
- There are fewer large nodes (which might not be true for other assemblies)
- Communities of related types tend to emerge, highlighted by the red lines. It would be interesting to run clustering algorithms such as k-means and color the nodes by cluster.
Creation
More complicated than Composition but less complicated than Calls (366 nodes and 612 edges).
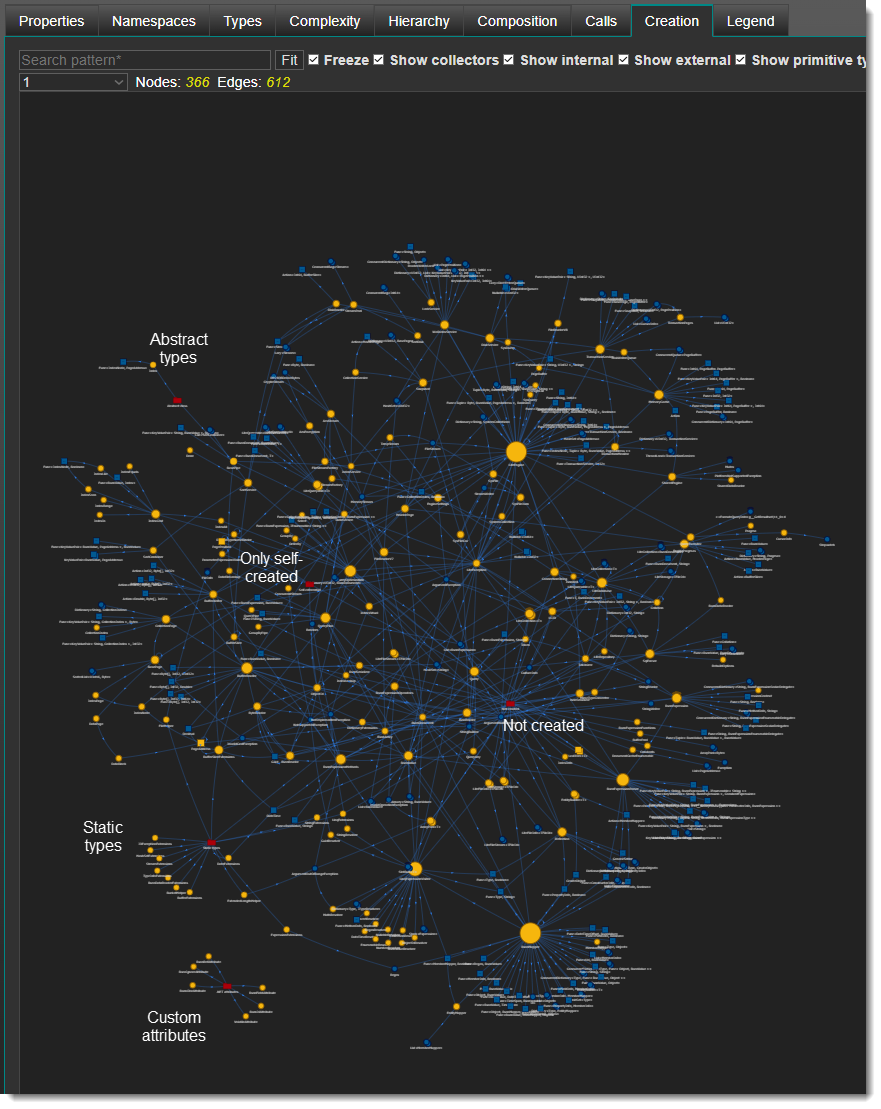
A few notes:
- The important nodes are more evident in this network than the composition, we can see there are three classes doing a majority of object creation.
- I have only placed white text showing that custom attributes, abstract types and static types cannot be created. There are a number of types that only create themselves, and others that are never created (presumably when you use LiteDB, you create them) ((or, I have failed to detect how they are created and some really smart people are going to tell me)).
-
Type views
The previous section dealt with the assembly as an aggregate unit; now let use drill down to individual types. Let's go back to the Structure Tree and open up the LiteDB node by clicking on the little triangle. I have opened the module (LiteDB.dll) and the LiteDB namespace and exposed the types that live there. I have also opened the Structure legend accordion to show the color mapping of tree node to type kind.
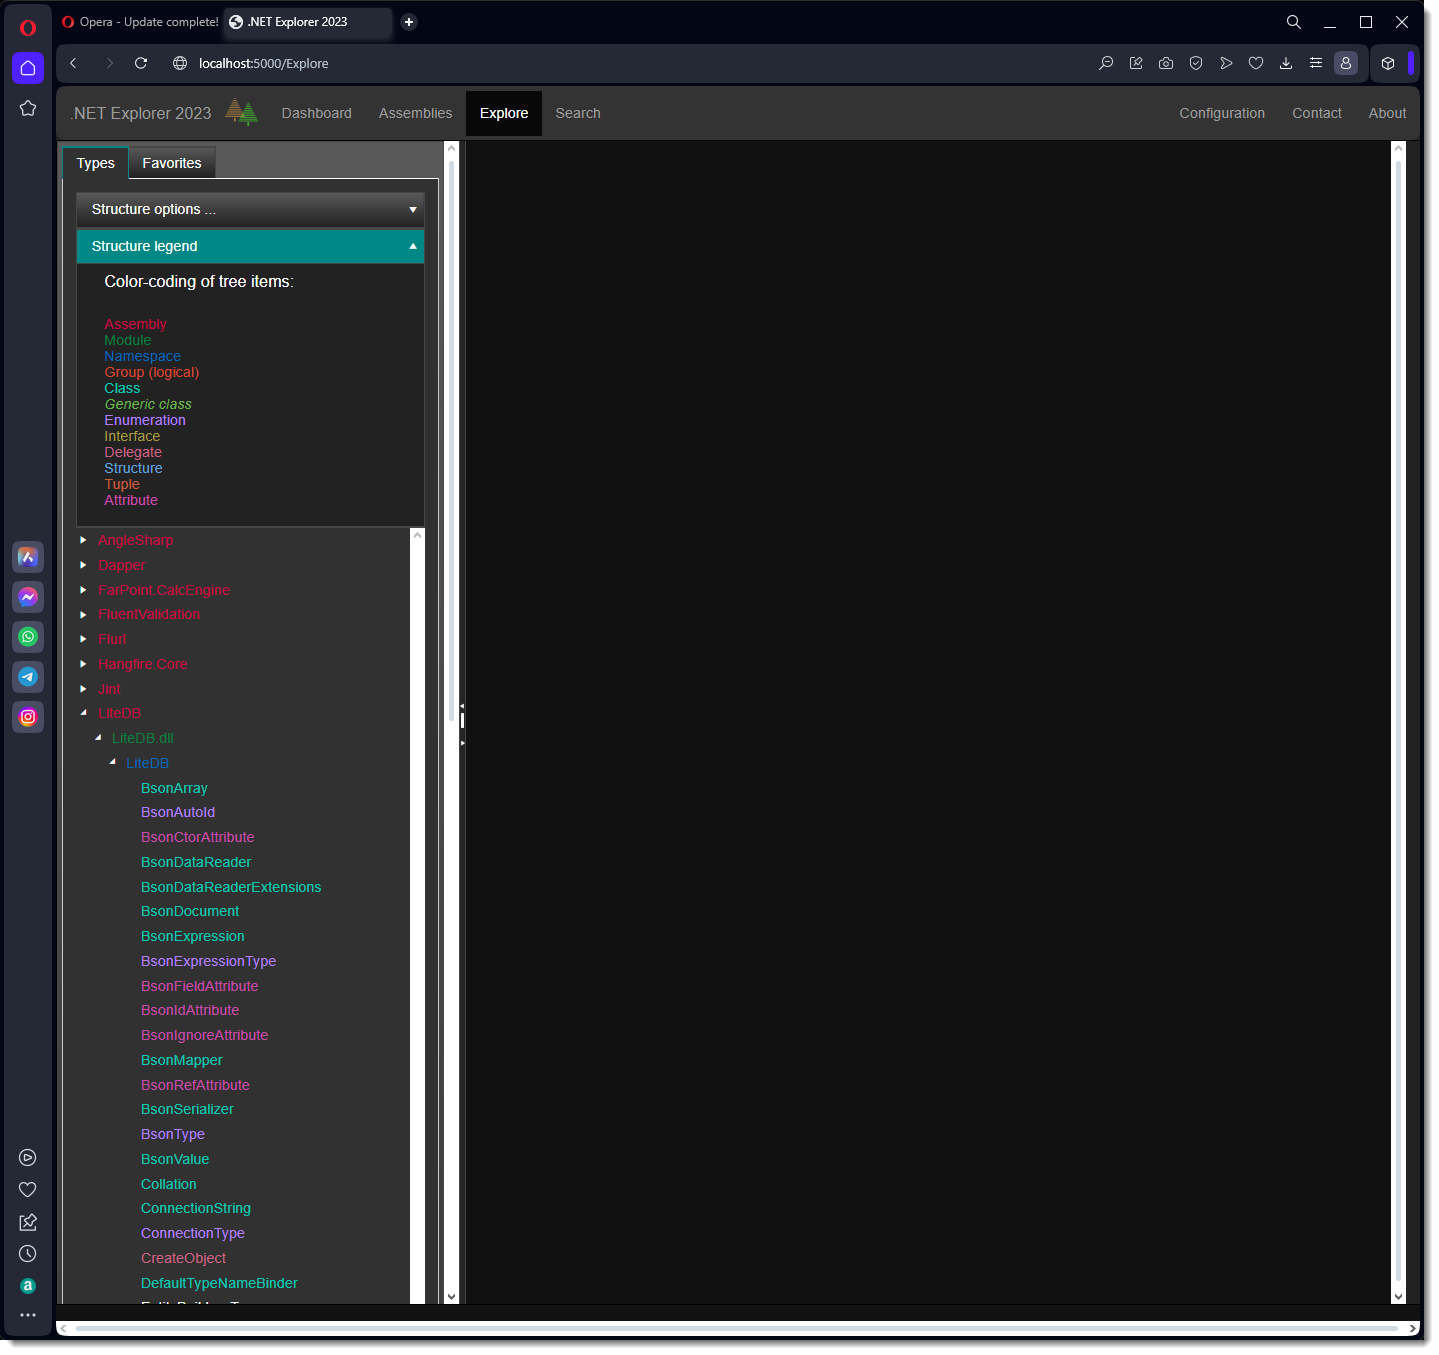
You can control the structure of this tree by dropping down the Structure options ... accordion and making changes. When you close the accordion, the tree is recalculated (and stored to a database). I will now close the legend and click on the ILiteCollection<T> node.
The right pane is now filled with 3 type visualizations (recall the tabs are load-on-demand), and the first tab is activated automatically with what I call the type emitter.
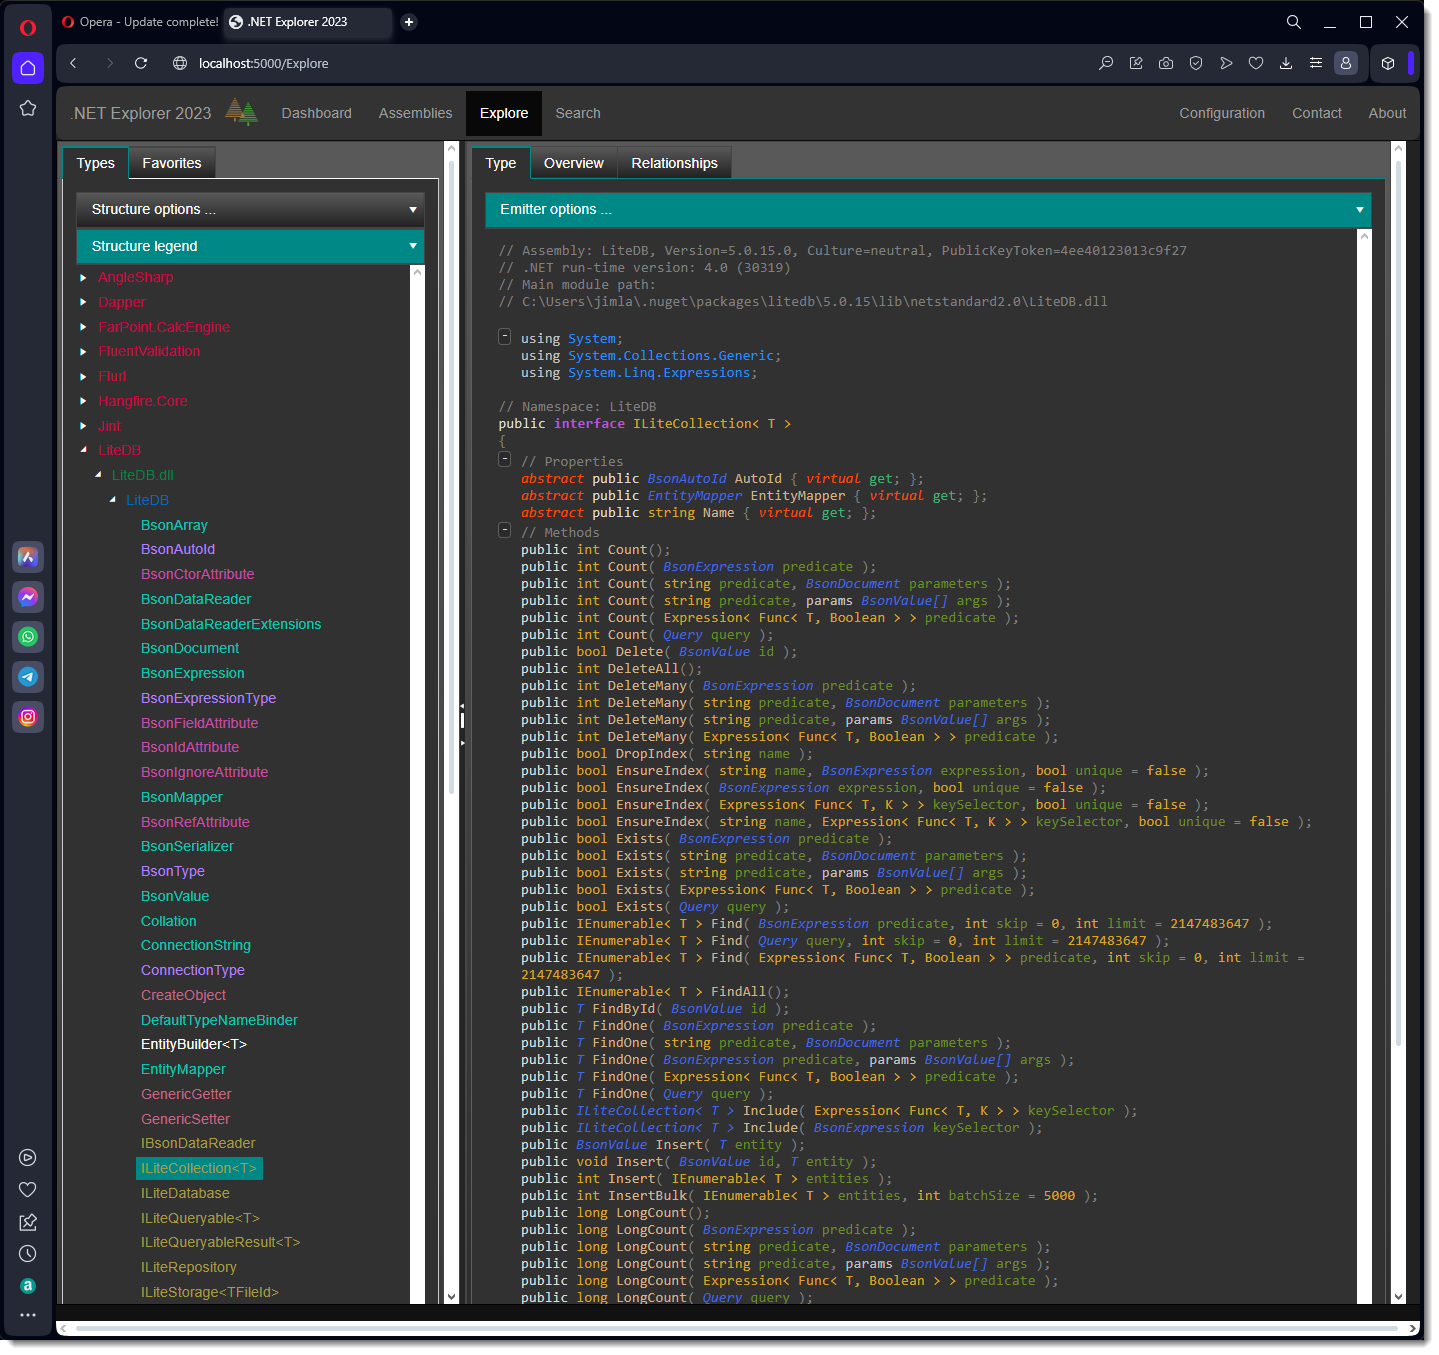
A few notes:
- If you use Visual Studio, you will see the resemblance to the Object Browser, although I have injected mine with many steroids.
- You can configure what you see by dropping down the Emitter options ... accordion, make changes and when you close the accordion, the type is re-emitted.
- Attribution: I stole the colors from JetBrains, and I think it was a contest winner for Rider editor colors, but I lost that paper scrawl a million years ago. Thank you JetBrains and contest winner!
- Personally I think the red highlights important software design elements such as abstract and virtual.
- You can collapse things such as the list of Methods to hide noise
- If you hover over the dark blue Type elements, you will see they are HTML hyper-links
Now click on the EntityMapper type reference near the top:
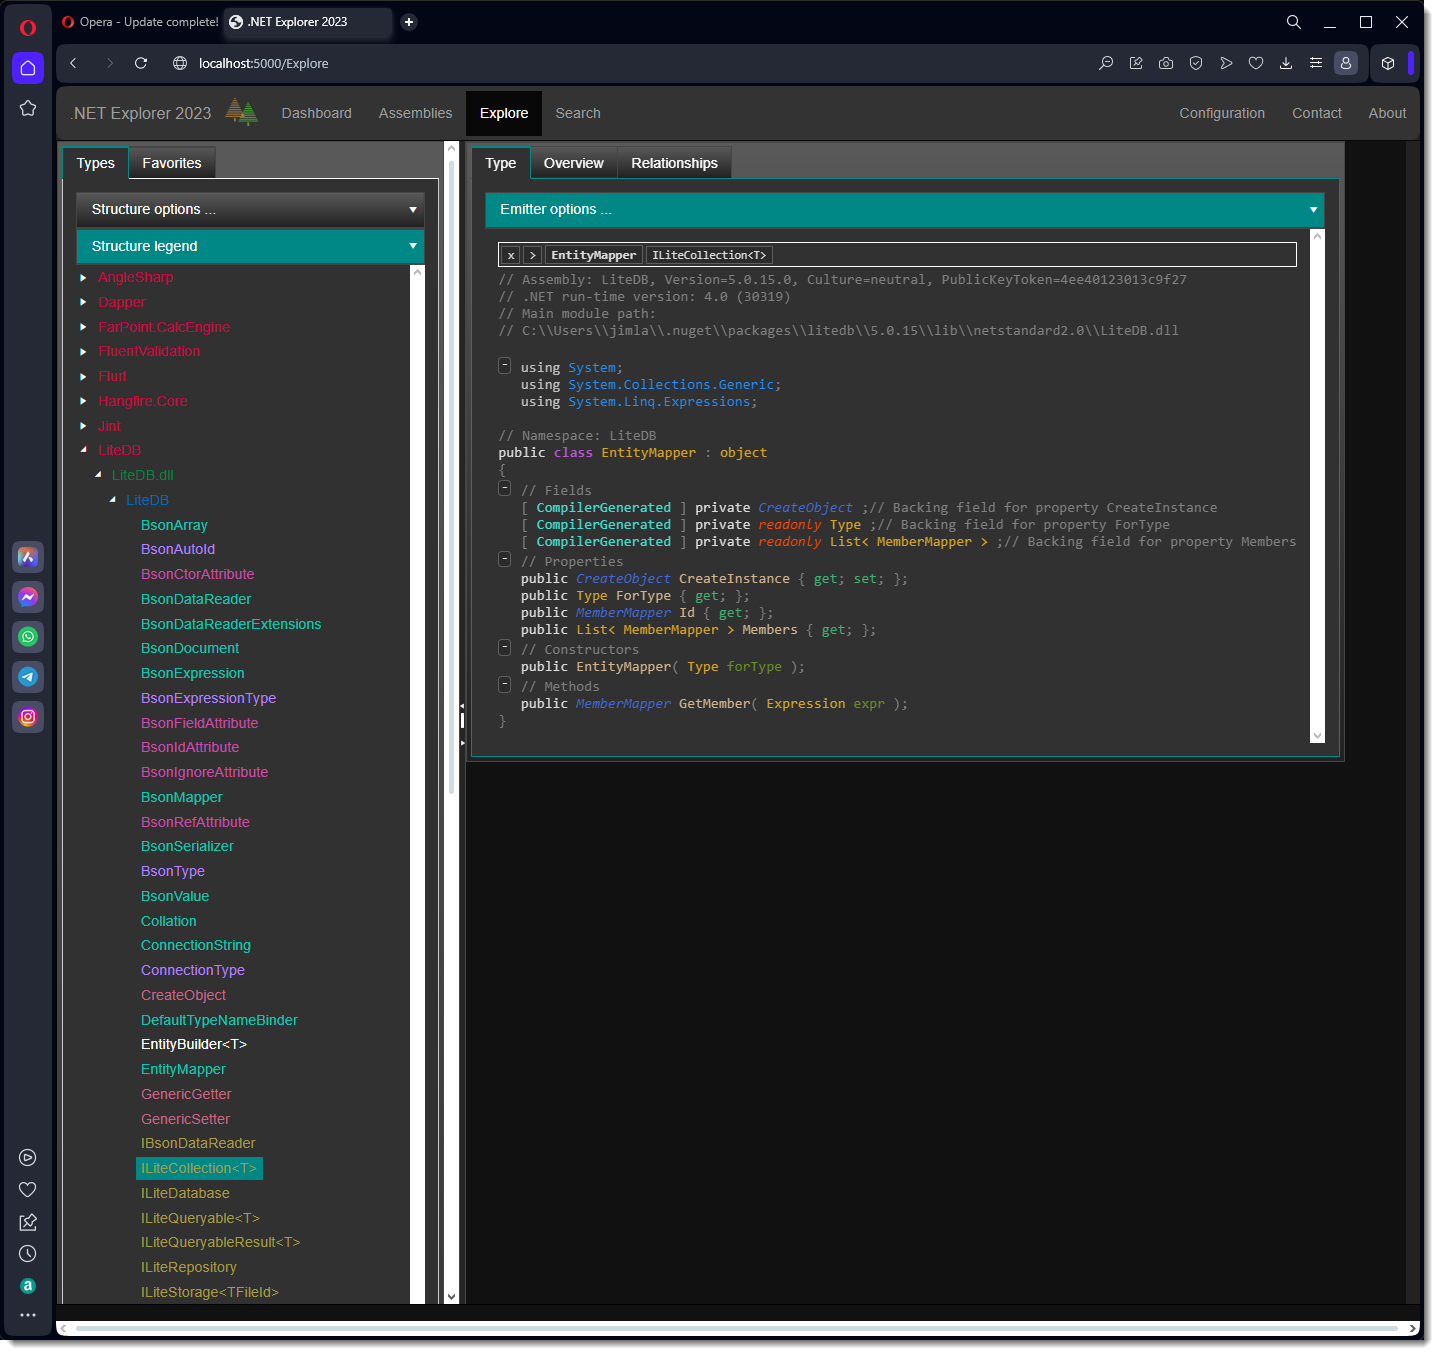
A few notes:
- The entire right explorer pane was thrown out (its part of the DOM destroyed), and replaced with a new explorer looking at the EntityMapper class.
- Again notice red is important marking readonly.
- Notice that we can explicitly see compiler-generated backing fields (currently view compiler-generated is turned on).
- Notice the new Navigation bar at the top of the emitted output. It shows we are on EntityMapper and we were just on ILiteCollection<T>. This bar let's you freely traverse many types and return back (even jumping back several layers) to where you we.
Now let's click on the Overview tab:
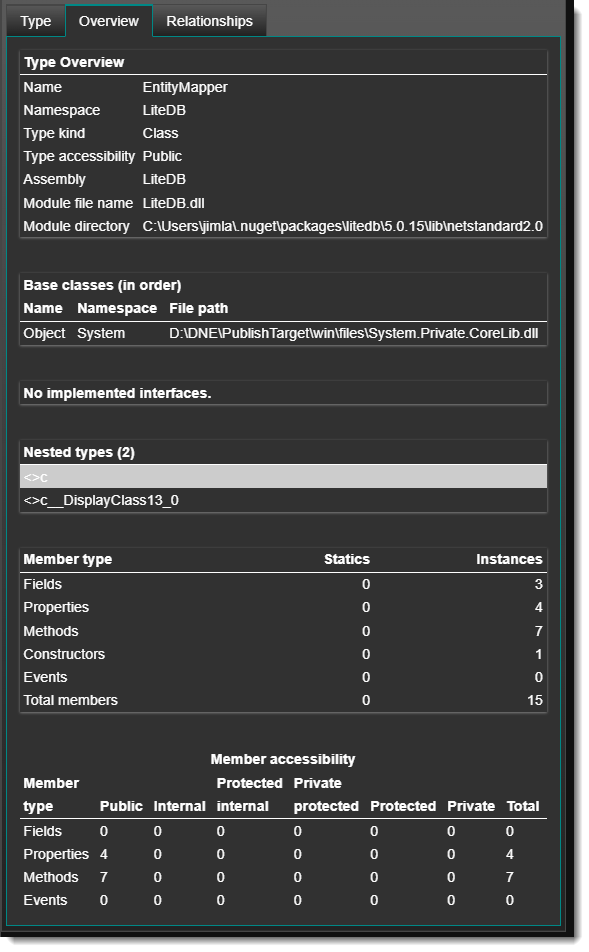
Sigh. What can I say? I can see there is a CSS bug and some color is missing. Moreover, this was the second UI I wrote after the emitter, and it looks like it died of neglect. I will polish this up in the near future.
Quick! Click on the Relationships tab!
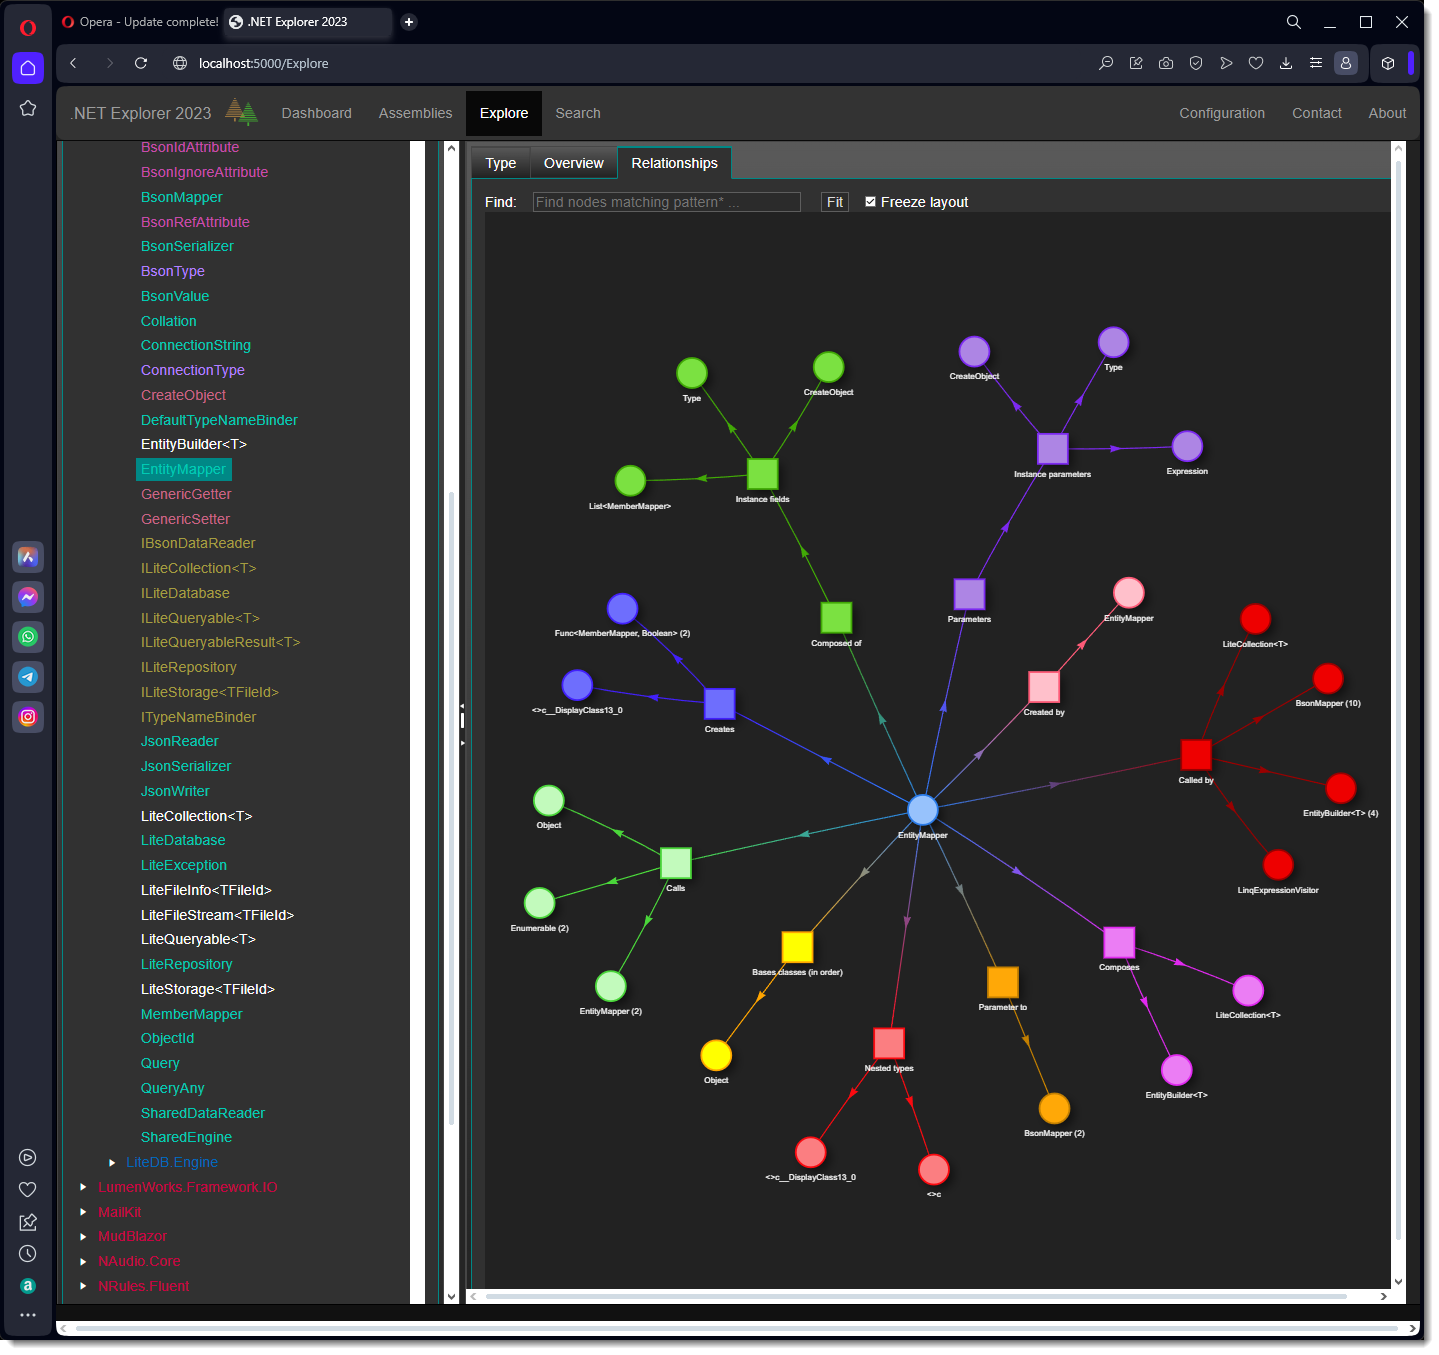
Lots of things to say here:
- This is the same network visualization engine as in the assembly networks. This is the first one I created and it is yet to evolve into something better (I will wait for feedback).
- This network is an amalgam of the assembly networks, but only focused on a single type.
This network shows:
- Base class
- Implemented interfaces
- Nested types
- What types it is composed of
- What types it composes
- What it creates
- What creates it
- What is calls
- What calls it
- What types are parameters on its methods (coupling)
- What types accept it as a parameter (coupling)
- Exposure to unhandled exceptions
The diagram is not very interactive, but it packs a lot of information. Improvements to this visualization will be driven by you.
Search
Hang in there, last section I want to talk about in this tutorial. I want to say outright is that what I have so far is a good start. There is so, so much more that can be done, but needs to be done in consultation. For example, would you be OK with a Neo4J server running on your machine. How about VelocityDB and VelocityGraph?
For now, I will describe what I have. I have navigated to the Search element of the navbar at the top of the page, and for now, to the Examples tab so I can talk about what Semantic search is:
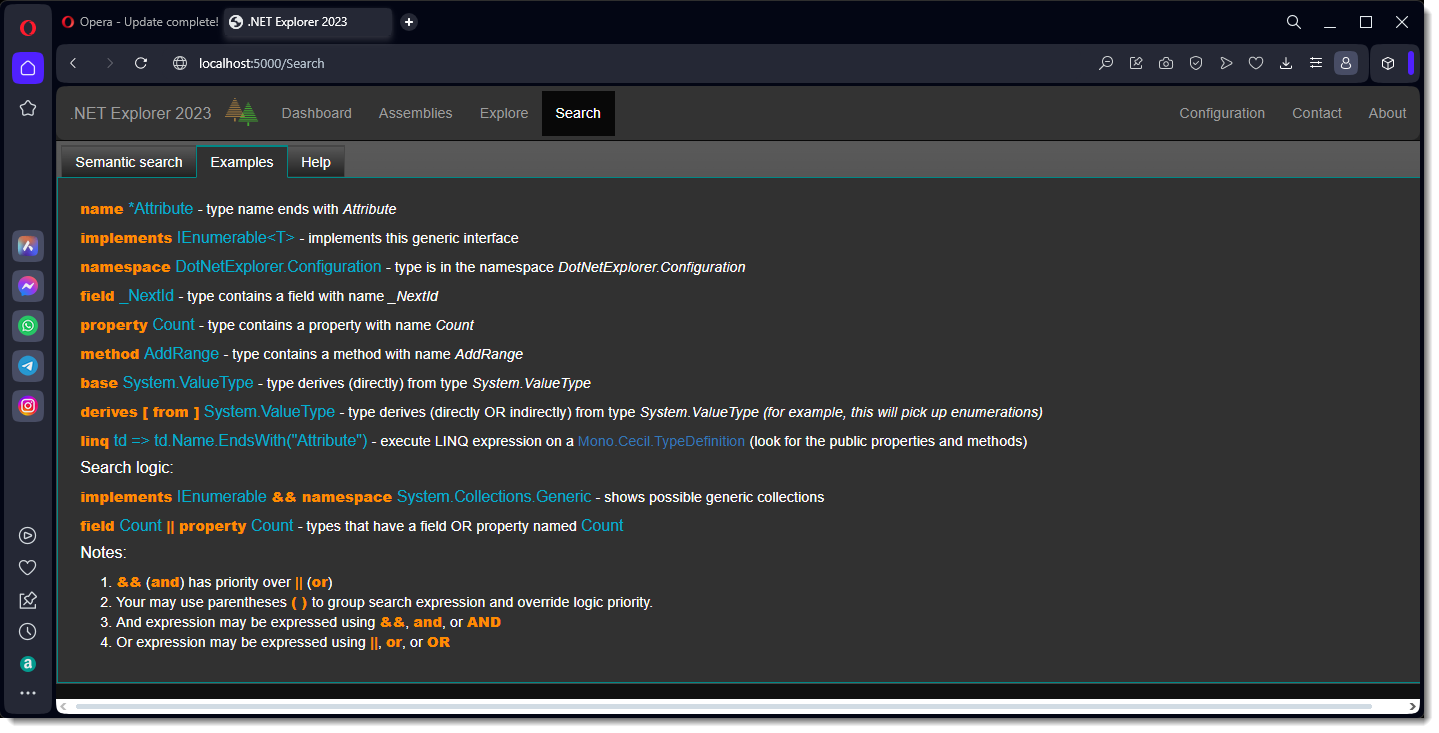
I hope you are finding point-form notes easier to read. Here is an explanation of search:
- Search currently always happens on the entire Analysis Set. I eventually want more control: search my NuGet folders, search my "directories of interest," or define an independent search set.
- When the Object browser in Visual Studio searches for a string, it is like doing a search on directory tree for any occurrence of that file (the Object browser has its own Analysis Set).
- I created a format language (no name) using Coco/R. The language is very simple and has essentially context and search phrase and a smattering of Boolean logic. So what is a Semantic search>. You provide the context, and it limits the search to that. A concrete example is implements IDisposable. The search only returns types that implement that IDisposable interface, not where it accepts it as a parameter
- Search is limited to type queries, but I think that should extend to assembly queries. I think it should also return more information when pattern matching is used.
- I broke my own rule and jammed in a linq context at the last second. It is extremely powerful, but requires knowledge of Mono.Cecil because I use it, and not System.Reflection. I will document this feature in the application fairly soon (yes, fairly is a weasel word).
Now I have returned to the Semantic search tab and entered the query: "implements IDisposable"
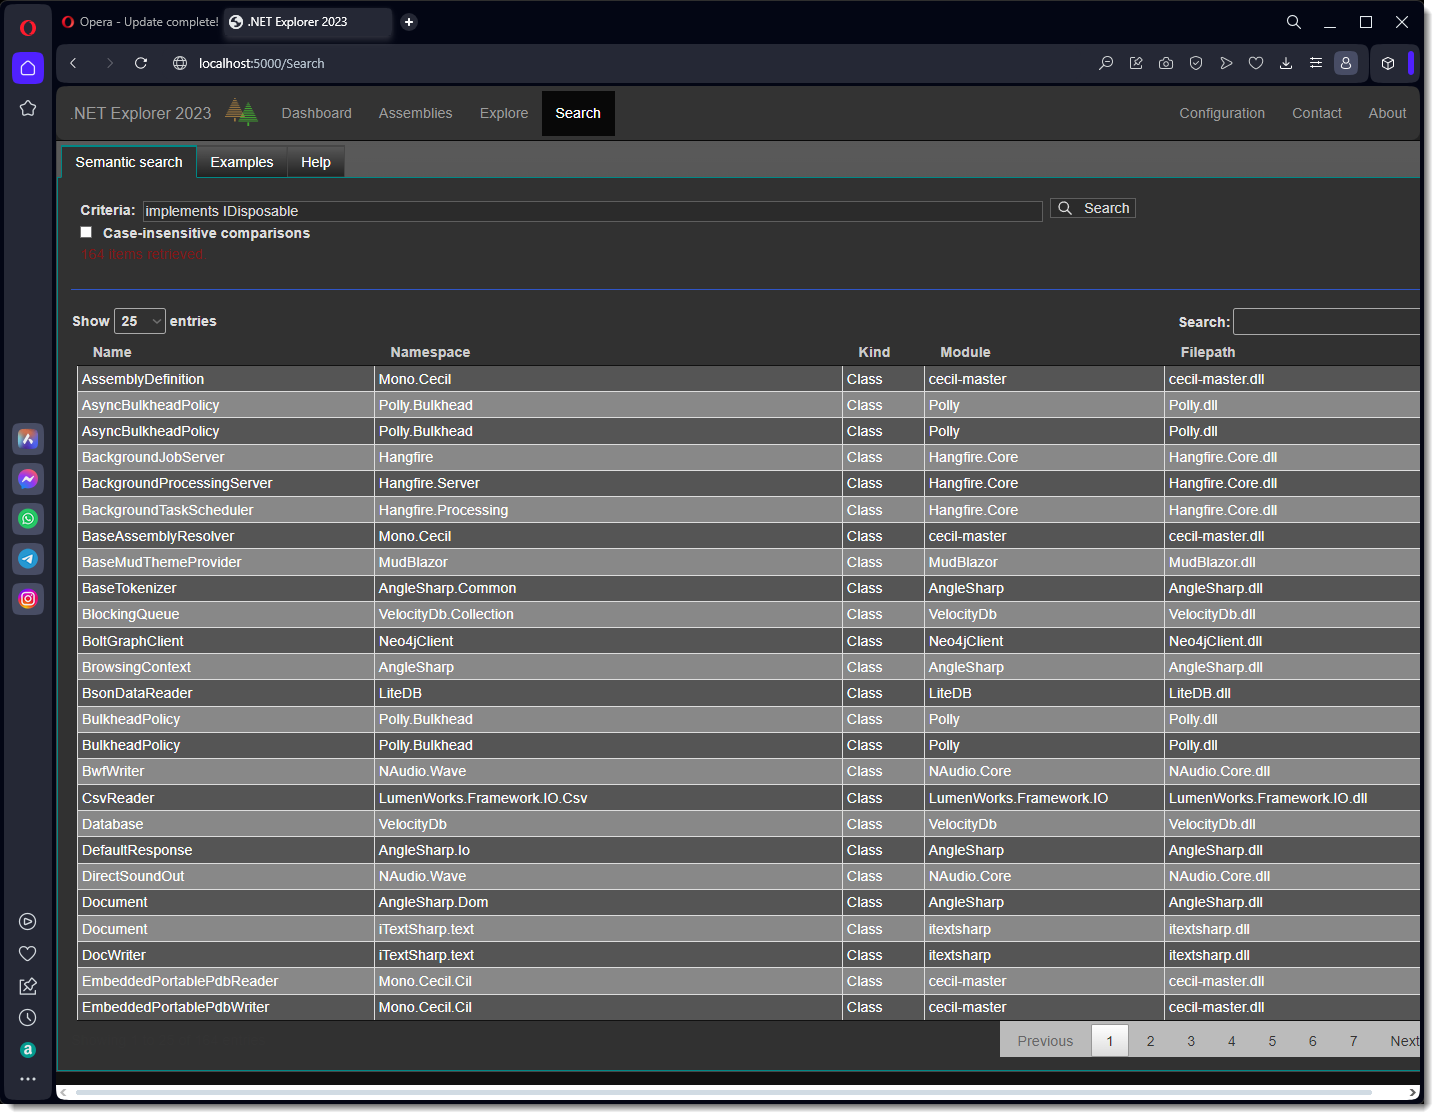
As mentioned before, the formal language only deals with returning types. In this case, it is returning types that we know we must use a using clause. I have plans to be able to add a found type to the Favorites list.